Drone Wind Turbine Inspection in India — No Shutdown, Full Blade Coverage

DGCA-certified pilots fly radiometric thermal and 4K visual surveys across every blade surface, without stopping the turbine. Geotagged, manufacturer-format defect reports delivered within 24 hours.

Reviewed for technical accuracy by Lesoko’s DGCA-certified inspection engineering team, in line with IEC 61400 and DNV GL blade-inspection reference frameworks.

5+ lakh
Drone Flights Completed
40–60%
Cost reduction vs specialist ground crew
100%
Blade surface coverage all surfaces, geotagged

24 hr

Report delivery after flight completion

No

Turbine shutdown required
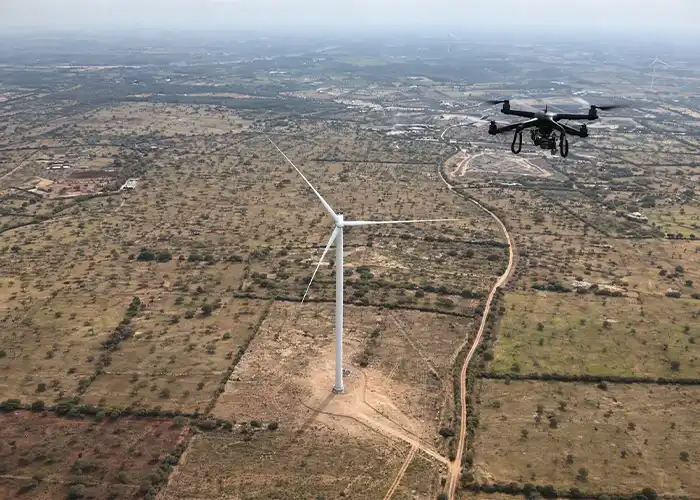
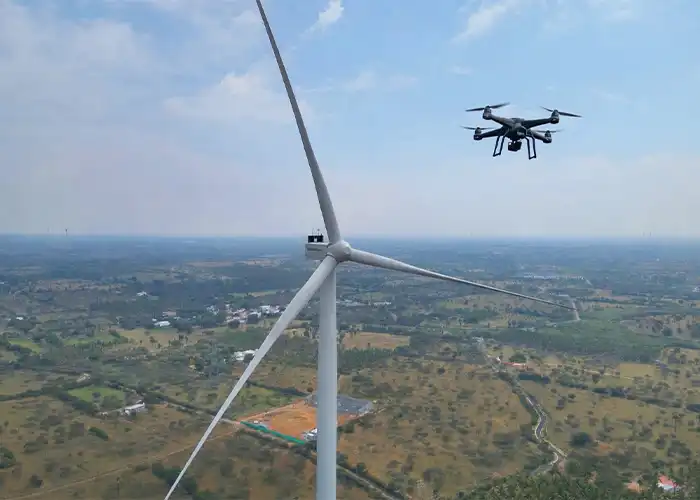
Drone conducting aerial survey alongside wind turbine over dry agricultural landscape in India, additional turbines on horizon

What Is Drone Wind Turbine Inspection?

Drone wind turbine inspection uses DGCA-licensed unmanned aircraft equipped with radiometric thermal sensors and 4K visual cameras to assess blades, nacelle, tower, and hub without rope access or turbine shutdown. The aircraft captures visual and thermal data across all blade surfaces, geotagging each detected defect to GPS coordinates. Deliverables are structured in manufacturer-format reports covering leading-edge erosion (LEE), delamination, surface cracks, lightning damage, and thermal hotspots.

The thermal layer is what separates aerial inspection from a simple photo survey: radiometric sensors detect temperature variation across the blade surface, and that variation indicates subsurface anomalies moisture ingress, disbonding, early-stage delamination invisible to a visual-only inspection. A certified engineer then reviews flagged zones to confirm genuine defects against imaging artefacts like soiling or sun glare, before the finding is logged.

Compared to rope-access inspection, which requires 6–12 hours per turbine with crews working at 80–120 m and the turbine fully shut down, aerial survey compresses the same coverage into a single same-day visit with no shutdown required directly protecting Annual Energy Production (AEP) during the inspection window itself.

Quadcopter drone with camera hovering at nacelle height close to wind turbine blade during aerial inspection, India
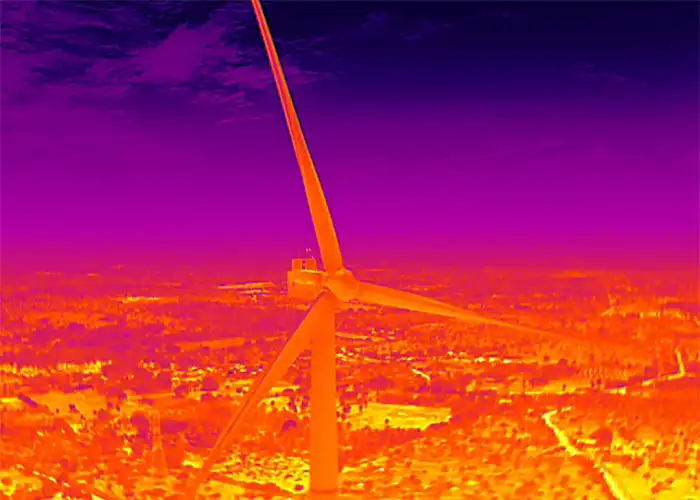
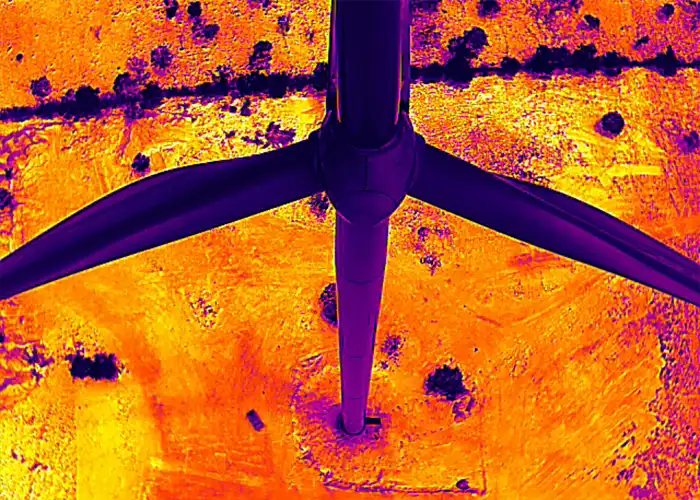
Overhead thermal image of wind turbine hub and three blades in star formation, blades cooler than surrounding ground
The Problem

Why Conventional Turbine Inspection Falls Short

Rope-access crews working at 80–120 m altitude for 6–12 hours per turbine, with the turbine shut down for the full duration, translate into weeks of lost inspection time and generation downtime across a 50-turbine wind farm. Undetected leading-edge erosion degrades aerodynamic performance progressively, reducing Capacity Utilisation Factor (CUF) and AEP before the drop is visible in SCADA dashboards by which point structural repair costs significantly more than early intervention would have.

Workflow

How Drone Wind Turbine Inspection Works

A six-step process from site planning to engineer-reviewed report delivery, with reports issued on a fast, structured turnaround after flight.

 
1

Pre-flight Planning

Site assessment, blade orientation mapping, and regulatory clearance submission completed before mobilisation.

4

Data Capture

4K visual imagery and radiometric thermal data captured simultaneously, with GPS-accurate geotagging per defect zone.

2

Site Risk Assessment

DGCA-compliant safety protocols, real-time wind speed monitoring, and insurance documentation verified before flight.

5

Defect Analysis

AI-assisted anomaly detection followed by certified engineer review, differentiating genuine erosion or delamination from surface soiling.

3

Flight Execution

A licensed pilot operates the drone at minimum safe distance across all blade surfaces, timed to avoid understated thermal readings from low early-morning irradiance.

6

Report Delivery

Manufacturer-format reports with maintenance prioritisation sheets delivered on a fast, structured turnaround after flight completion.

Detection

Blade Defects Detected by Aerial Survey

Aerial blade thermography with certified engineer review covers structural and surface defects, including subsurface anomalies invisible to visual-only inspection.

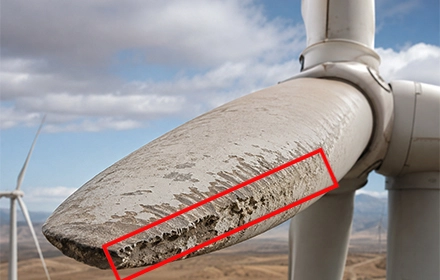
Wind turbine blade showing severe erosion with white gelcoat stripped and dark composite substrate exposed, red annotation on worst damage zone

Leading-Edge Erosion (LEE)

Abrasive particle impact at high rotational speed progressively degrades the aerodynamic profile. Reduced output appears first as gradual energy yield decline, well before it's visible from the ground.
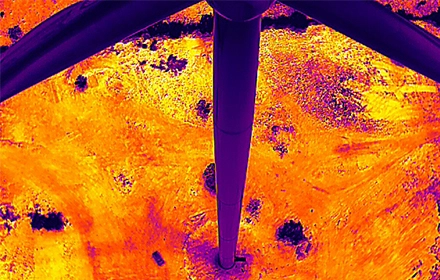
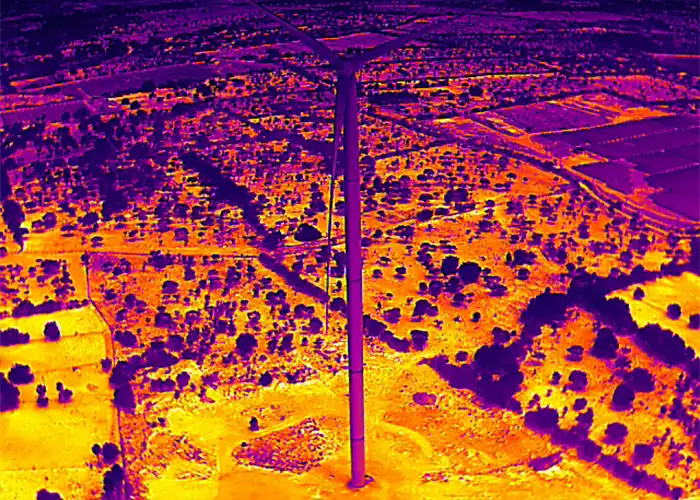
Overhead thermal aerial image showing wind turbine tower in cool purple tones against hot orange ground with distinct cooler patches visible below

Thermal Hotspot

Manufacturing voids or moisture ingress create localised thermal stress zones. LEE often shows as a gradual thermal gradient shift rather than a sharp hotspot distinguishing the two requires engineer review, since soiling can mimic the same pattern.
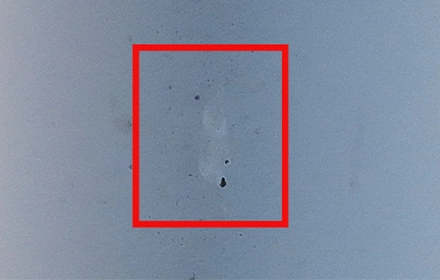
Close-up of wind turbine surface showing pale oil seepage and fluid droplet accumulation spots highlighted within red annotation rectangle

Oil Pollution

Nacelle seal failure or gearbox leakage deposits oil on blade surfaces, accelerating corrosion and aerodynamic degradation.
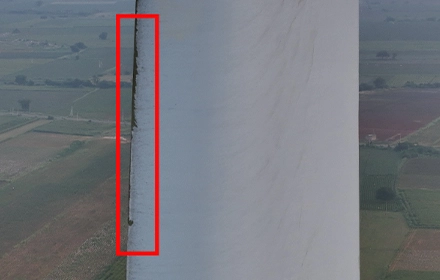
Aerial close-up of wind turbine blade leading edge showing dark material loss and erosion damage within red annotation rectangle

Paint Peel-off

UV degradation detaches gelcoat and surface coating layers, removing the primary moisture barrier and accelerating LEE progression.
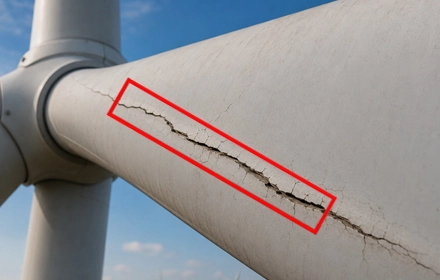
Wind turbine blade showing multiple surface cracks across coating within red annotation rectangle, nacelle and blue sky in background

Surface Crack

Mechanical stress and thermal expansion cycles generate hairline cracks that allow moisture ingress, escalating to delamination without early intervention.
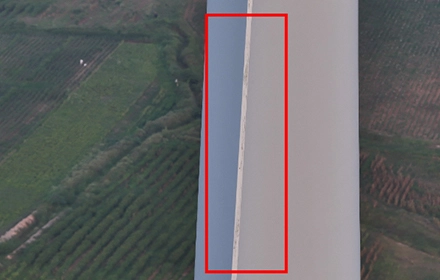
Aerial view of wind turbine blade showing surface seepage marks in red annotated zone, agricultural landscape below

Surface Seepage

Blade sealant failure allows moisture ingress along seam lines, initiating internal moisture damage and delamination risk detectable by thermal imaging before it surfaces visually.
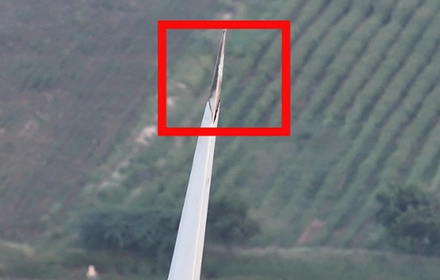
Aerial close-up of wind turbine blade tip showing erosion damage with red annotation, green terraced agricultural landscape below

Tip Erosion

Accelerated wear at the blade tip from peak rotational velocity creates structural fatigue zones and measurable energy output decline an early indicator of overall blade condition.
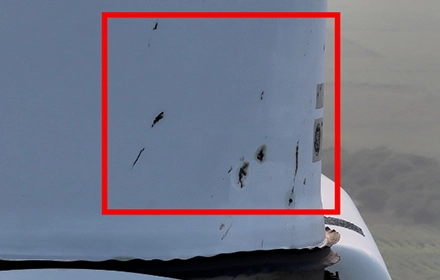
Close-up of wind turbine blade surface showing dark elongated stress marks and material scoring from cumulative mechanical wear highlighted within red annotation rectangle

Wearing

Repeated stress cycles from wind loading create cumulative fatigue at blade surfaces, with root joint and blade-to-hub transition zones particularly susceptible.
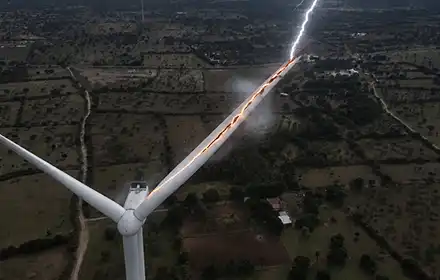
Wind turbine blade struck by lightning, bright bolt visible along blade length against dark stormy sky over agricultural landscape

Lightning Damage

Strike events cause internal blade damage not visible at the surface. Radiometric imaging identifies subsurface thermal anomalies introduced by strike energy across the blade cross-section.
Severity Framework

How Defects Are Classified by Severity

Severity 1

Monitor only

Surface soiling, minor gelcoat discolouration, or cosmetic marks with no measurable aerodynamic or structural impact. Logged for baseline tracking; no action required this cycle.

Severity 2

Plan for next scheduled window

Early-stage LEE, hairline coating cracks, or isolated pinholes. Repair is inexpensive at this stage and typically scheduled into the next pre- or post-monsoon maintenance window.

Severity 3

Repair within 3–4 months

Progressed erosion, visible surface cracking, or early delamination indicators. Left unaddressed, these typically escalate to structural repair costs within one to two seasons.

Severity 4

Repair within 3 months

Tip erosion with exposed substrate, confirmed delamination, or lightning-strike thermal signatures. Flagged for priority action to prevent structural failure or unplanned downtime.

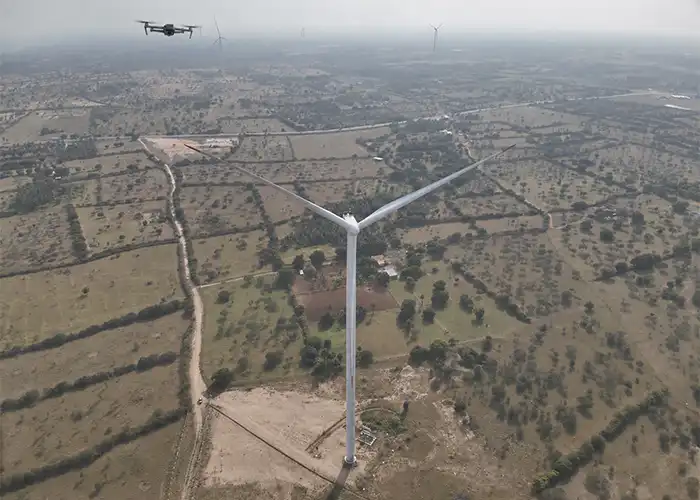
Small drone in flight above white wind turbine during aerial inspection over agricultural landscape in India
Technical Methodology

How Aerial Blade Thermography Works

Drone proximity flight protocol positions sensors at minimum safe distance from blade surfaces across all three blades per turbine. Radiometric thermal sensors operating at a minimum resolution of 640×512 capture temperature-accurate data per pixel, enabling defect mapping beyond what visual-only systems detect including across the spar cap and shear web zones, structural failure paths that visual inspection alone cannot reach. Optimal thermography requires irradiance above 600 W/m², wind speeds within site-specific operational limits, and time-of-day scheduling that avoids nacelle shadow interference, which can otherwise distort thermal readings.

Image processing generates orthomosaic blade maps with radiometric correction applied. AI-assisted detection flags candidate anomalies; a certified engineer then reviews each one to differentiate LEE from soiling, delamination from surface marks, and genuine hotspots from imaging artefacts.

Wind farms in Tamil Nadu and Karnataka face monsoon restrictions from June through September pre-monsoon inspection cycles in April–May and post-monsoon surveys in October–November are the standard scheduling windows. Coastal sites like Muppandal in Tamil Nadu and Kutch in Gujarat experience salt mist deposition that can mimic early-stage erosion under visual inspection; thermal differentiation by a certified engineer is required to distinguish salt-induced temperature variation from genuine delamination or erosion.

Thermal aerial image of wind turbine and nacelle in false-colour infrared palette, tower prominent against purple sky
Wide thermal aerial image of wind turbine tower over agricultural landscape in infrared false-colour palette

Compliance and Safety

All Lesoko pilots hold DGCA certification for commercial drone operations under UAS Rules 2021, with no subcontracting every inspection is flown by a certified, insured in-house pilot. Full liability insurance coverage is included on all projects, and NDA options are available for sensitive site data and inspection records. Reports are structured to align with IEC 61400 and DNV GL blade-inspection reference frameworks, supporting both OEM warranty submission and lender technical auditor (LTA) review.

Who Uses Lesoko Wind Turbine Inspection

Wind O&M Managers

Rope-access inspection is costly, slow, and misses subsurface defects that aerial thermography reliably detects in a single survey. Where SCADA dashboards show unexplained CUF deviation, aerial inspection identifies whether blade condition — rather than wind resource variability — is the root cause.


EPC Heads, Wind Energy Projects

OEM warranty transfer requires documented baseline inspection at commissioning. Geotagged imagery and radiometric data provide handover documentation that manual inspection cannot reliably generate.

IPPs and Utility Procurement Teams

Manual climbing inspection scales poorly across large portfolios. A single pan-India vendor with consistent quality and meaningfully lower per-turbine cost changes fleet maintenance economics.

Lender Technical Auditors and Independent Engineers

LTAs require documented baseline and periodic inspection records to validate asset condition for project finance and refinancing. Subjective rope-access reports without GPS coordinates are increasingly rejected by LTA review teams.

Field Case Study

WTG Blade Inspection — 1.7 MW Wind Turbine, Andhra Pradesh

GE 1.7 turbine, 50.2 m blades, inspected 26 Mar 2026. Six anomalies logged across all three blades — no stoppage, geotagged anomaly records delivered within 7 days.

Turbine Model

GE 1.7 MW

Blade Length

50.2 m

Inspection Date

26 Mar 2026

Anomalies Found

6 across 3 blades

Anomaly ID Blade Location Defect Severity Action
110001 Blade A Leading Edge Erosion 3 · Medium Repair in 3–4 months
110002 Blade A Pressure Surface Tip Erosion 4 · Serious Repair in 3 months
110003 Blade B Leading Edge Erosion 3 · Medium Repair in 3–4 months
110004 Blade B Pressure Surface Tip Erosion 4 · Serious Repair in 3 months
110005 Blade C Leading Edge Erosion 3 · Medium Repair in 3–4 months
110006 Blade C Suction Surface Tip Erosion 4 · Serious Repair in 3 months

Finding

Leading-edge erosion and tip erosion detected across all three blades. Severity 4 tip erosion flagged for repair within 3 months; medium-severity erosion within 3–4 months. The turbine continued operation — no stoppage required.

Pan-India Operations

Drone Wind Turbine Inspection Coverage Across India

Pan-India deployment with capability within 48 hours for wind farms above 10 turbines. Same-day deployment is available in Chennai, Bengaluru, and Hyderabad for urgent requirements. Lesoko has completed surveys at wind assets in the Muppandal wind zone (Tamil Nadu), the Jaisalmer Wind Park corridor (Rajasthan), and Kutch coastal wind farms (Gujarat).

Monsoon scheduling: the Southwest monsoon (June–September) restricts inspection windows across Tamil Nadu and Karnataka wind corridors. Lesoko deploys proactively in the February–April pre-monsoon window for operators planning annual O&M cycles.

Pricing

Cost and Pricing: Drone Wind Turbine Inspection

Pricing depends on turbine count and total MW capacity, site location and mobilisation requirements, inspection scope (blade-only vs. full turbine including tower, nacelle, hub), terrain and accessibility, report depth (standard vs. forensic), urgency, and monsoon-window scheduling. Wind farms with larger fleets typically see lower per-turbine pricing due to fixed mobilisation costs spread across more units.

Beyond one-time inspection, Lesoko offers annual and multi-year inspection contracts for wind farms requiring repeat LEE progression tracking. Contract-based scheduling locks in pre-monsoon and post-monsoon windows in advance, removing the need to re-procure each cycle useful for O&M teams working to a fixed annual maintenance budget.

Watch How Lesoko Inspects a Wind Turbine

Our Amazing Clients

Deliverables

What Every Inspection Includes

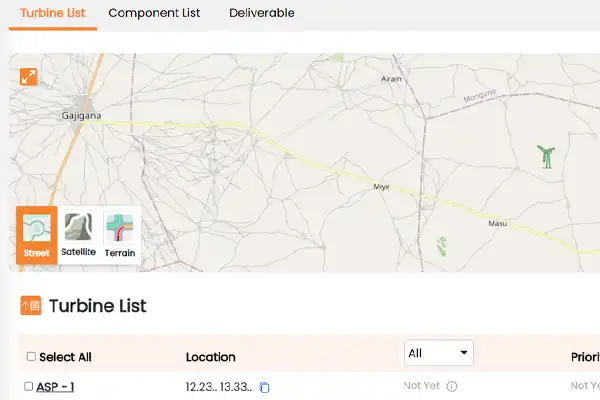
Inspection software dashboard showing turbine list with GPS coordinates and map view with turbine location markers, ASP-1 entry visible

Radiometric TIFF

Temperature-accurate blade anomaly data, compatible with SCADA and asset management software.
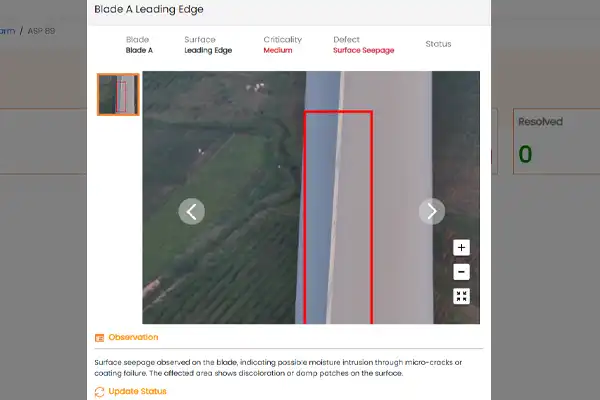
Inspection report showing surface seepage on wind turbine blade A leading edge, Medium criticality, red annotation marking affected zone over aerial view

Geotagged Defect Reports

Exact GPS coordinates per defect zone, KML geo-data for GIS/CAD integration.
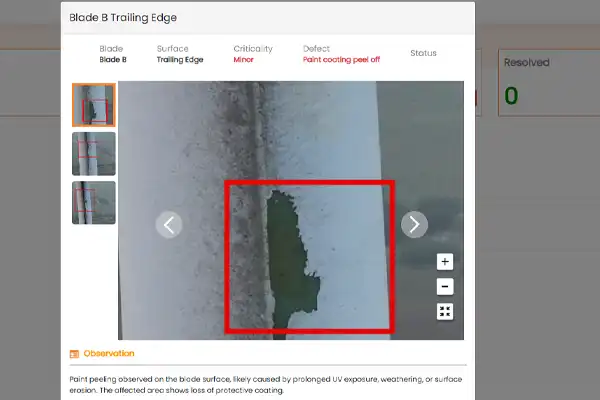
Inspection report showing paint coating peel-off on wind turbine blade B trailing edge, criticality Minor, defect annotated with red rectangle

Maintenance Prioritisation Sheets

Actionable repair schedules by severity, Excel format.
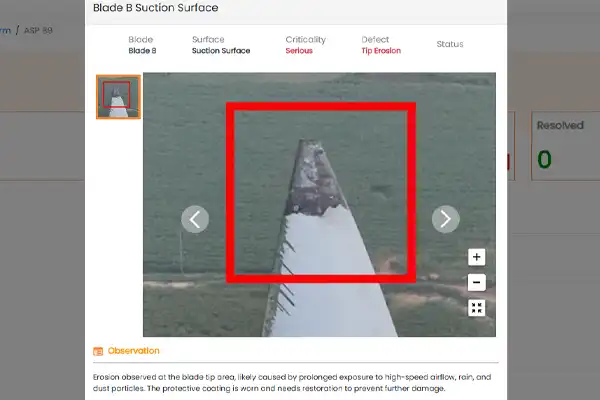
Inspection report showing serious tip erosion on wind turbine blade B suction surface, defect area marked with red rectangle, green landscape below

Inspection Summary Dashboards

Executive-level condition overview for fleet O&M planning.

Ready to Protect Your Wind Assets?

Free · No obligation · Quote in 24 hours
 

Phone/ Whatsapp

+91 78457 26375

Email Us

sales@lesoko.in

Head Office

7QG, Dr. Radha Krishnan Salai, Sullivan Garden, Mylapore, Chennai, Tamil Nadu – 600004
 

Request Inspection Quote

Frequently Asked Questions

Drone wind turbine inspection detects leading-edge erosion (LEE), tip erosion, surface cracks, delamination, lightning damage, thermal hotspots, oil seepage, and paint peel-off. Radiometric thermal sensors identify subsurface anomalies moisture ingress, disbonding, delamination in spar cap and shear web zones invisible to visual-only inspection, which manual climbing methods routinely miss.

Drone wind turbine inspection is completed in a single same-day visit per turbine, compared to 6–12 hours using rope-access crews. Turbines remain operational with no shutdown required during the survey itself. A 50-turbine wind farm can be fully inspected within days rather than the weeks conventional inspection requires.


Pricing depends on turbine count, site location, terrain accessibility, inspection scope, and report depth. Larger turbine fleets typically receive lower per-turbine pricing due to fixed mobilisation costs spread across more units. Drone inspection generally costs meaningfully less than manual climbing methods once specialist crew costs, equipment, and shutdown downtime are factored in.


Wind turbine blades should be inspected annually at minimum for operational wind farms, with immediate inspection after extreme weather events such as storms, hail, or lightning strikes. High-capacity assets above 50 turbines often benefit from bi-annual surveys to catch early-stage erosion before it escalates to structural delamination.


Findings are logged on a four-tier scale: Severity 1 (cosmetic, monitor only), Severity 2 (minor, plan for next maintenance window), Severity 3 (medium, repair within 3–4 months), and Severity 4 (serious, repair within 3 months). This lets O&M teams prioritise repair budget by urgency rather than treating every flagged finding equally.


Yes. A commissioning baseline inspection before COD documents as-built blade condition and catches manufacturing or transport-related defects early. This baseline record is the reference point used for all future warranty claims, insurance discussions, and year-over-year erosion tracking.


No. Drone inspection operates without turbine shutdown blades remain in normal operating position during the survey. For close-proximity blade imaging, turbines may briefly be parked at a defined orientation for under five minutes per turbine, a standard O&M parked position that minimises generation impact. Some other inspection providers require the turbine to be fully stopped for the entire imaging session; Lesoko does not.


Yes. Reports are structured to align with OEM blade-inspection documentation requirements for all four manufacturers. Geotagged TIFF thermal data and GPS defect registers are provided in formats accepted for OEM warranty submissions and LTA audit packages, referencing IEC 61400 and DNV GL guidelines for report structure.


India’s largest wind energy states are Tamil Nadu, Gujarat, Rajasthan, Karnataka, Maharashtra, and Andhra Pradesh, together accounting for over 90% of India’s installed wind capacity. Lesoko operates across all of these states with licensed pilots and local deployment capability.


Yes. Lesoko participates in RFP-based procurement and vendor empanelment for wind asset inspection contracts. DGCA pilot certifications, liability insurance documentation, OEM-format sample reports, and scope-of-work templates are available on request for tender submissions.


Deliverables include PDF inspection reports, radiometric TIFF thermal data, high-resolution 4K imagery, KML geo-data, and Excel defect registers all compatible with GIS, CAD, SCADA, and asset management software. Structured reports are delivered on a fast, predictable turnaround after flight completion.


The pre-monsoon window (February–April) and post-monsoon window (October–November) are the standard scheduling periods for wind turbine inspection in India. The Southwest monsoon (June–September) restricts flight operations across major wind corridors in Tamil Nadu, Karnataka, and Gujarat, so O&M teams typically plan annual inspection cycles around these two windows.


Scroll to Top