
Track Every Milestone on Your Solar Construction Site Without a Single Site Visit
Solar EPC contractors, IPPs, and independent engineers use Lesoko’s drone-based project progress monitoring to replace subjective site-manager estimates with georeferenced, timestamped aerial data delivered on a weekly or fortnightly cadence, at any site size, anywhere in India.
Pile foundation counts, module stringing percentages, cable trench completion, and earthwork cut-and-fill volumes are captured in a single flight and compared directly against your approved construction programme giving EPC teams, project directors, and lender independent engineers a planned-versus-actual record they can act on the same week it’s issued.
±5cm
Ground sampling distance
48hr
Report turnaround
5 lakh+
Safe Drone Flights
0
Recorded crash incidents
PAN-India
Deployment Ready
What Is It
Drone Solar Project Progress Monitoring?
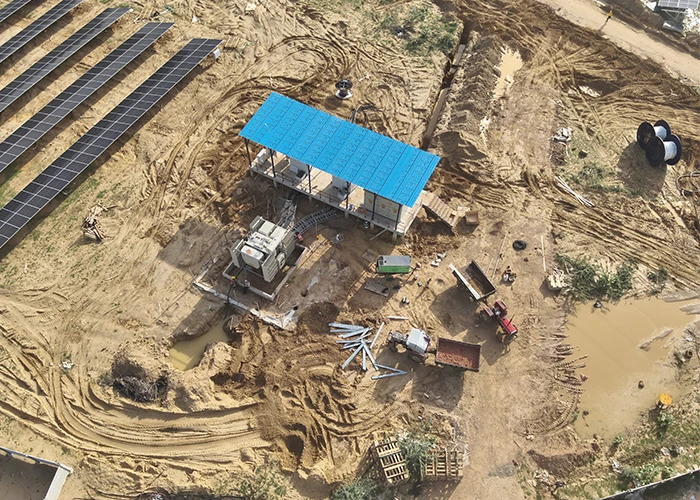
Drone solar construction progress monitoring is a recurring aerial data-collection and reporting service for active solar construction sites. DGCA-certified pilots fly the full site footprint at defined intervals typically weekly or fortnightly capturing overlapping high-resolution imagery that is processed into a georeferenced orthomosaic map of the site as it stands on that date.
Every survey is compared against two references: the previous flight, and the project’s approved baseline layout. That comparison produces a planned-versus-actual completion percentage by construction zone, replacing the site manager’s walked estimate with a measured, repeatable figure. Pile foundation counts, module row installation, cable trench progress, and inverter block civil works are all captured in the same mobilisation.
For IPPs, developers, and lenders, this turns construction reporting from a narrative update into spatial evidence: an independent engineer reviewing a drawdown tranche is looking at the same georeferenced imagery the EPC’s own site team is using to plan next week’s work.
Why It Matters
The Problem With Manual Site Progress Tracking
Estimates don't scale
A site manager walking a 200-acre array sees a fraction of the total area and produces a subjective, non-repeatable completion estimate for the rest.
Photo logs aren't comparable
Handheld photos taken from different positions and dates can’t be reliably overlaid against each other or the approved layout.
No shared reference for disputes
When a contractor’s stated completion differs from the owner’s assessment, there’s often no dated, spatially accurate record either side can point to.
Delays surface late
A correctable two-week lag often isn’t identified until a monthly review by which point it risks an MNRE or SECI milestone.
Lender reporting relies on narrative
Tranche packages built from written updates and static photos give an independent engineer less to verify against than a dated, georeferenced dataset.
How Drone Solar Project Progress Monitoring Works
Baseline capture
Before construction begins, or at the first monitoring milestone, a survey flight establishes a georeferenced baseline of the site. The fixed reference layer every later flight is measured against.
Flight planning & airspace clearance
Each mission is planned around the site's area and topography, with DGCA/DigitalSky airspace clearances secured and flight logs maintained.
High-resolution aerial data capture
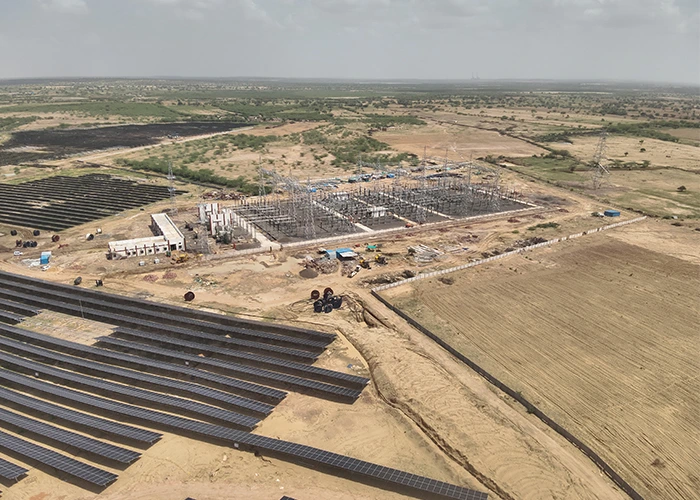
In-house DGCA-certified pilots fly systematic grid patterns at approximately ±5 cm ground sampling distance. Sites of 200 MW+ are typically covered in a single mobilisation day.
Photogrammetric processing
Captured imagery is processed into a georeferenced orthomosaic, a digital surface model, and where scoped a 3D point cloud.
Baseline & programme comparison
The new orthomosaic is registered against the approved layout and prior survey to calculate completion percentage by zone: piling, structure, module, trenching, and civil works.
Report delivery
Orthomosaic, comparison overlay, annotated findings, and zone-wise completion breakdown delivered within 48 hours formatted for EPC review, lender packages, and SECI/MNRE submissions.
Construction Deviations a Progress Survey Identifies
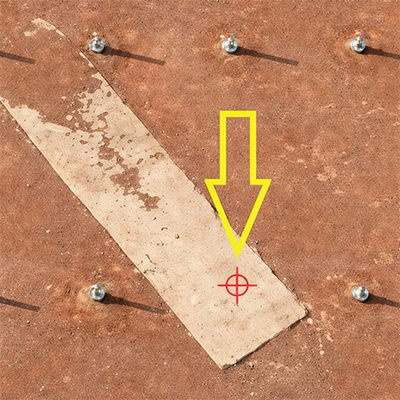
Foundation & piling deviations
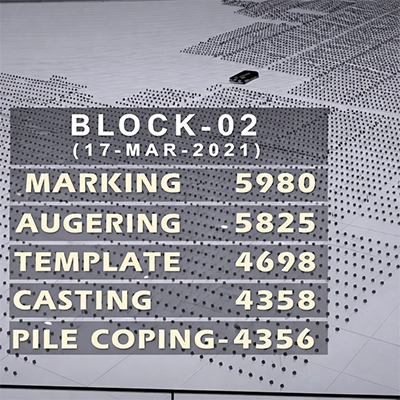
Pile position and count discrepancies against design, identified row-by-row and block-by-block. On Lesoko’s REWA 250 MW engagement, a single Block-02 weekly report tracked marking, augering, template, casting, and pile-coping as five distinct stages a level of granularity a general site walk-through doesn’t produce.
Module & structure gaps
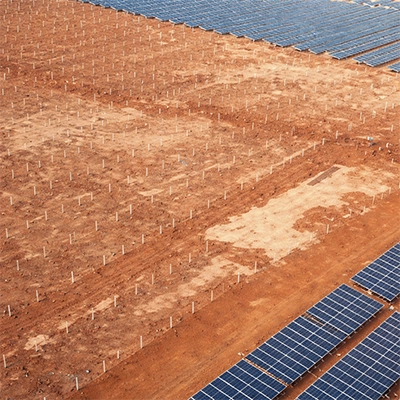
Row-by-row comparison of completed vs pending module installation and mounting-structure completion by zone, including missing structural sections invisible at ground level.
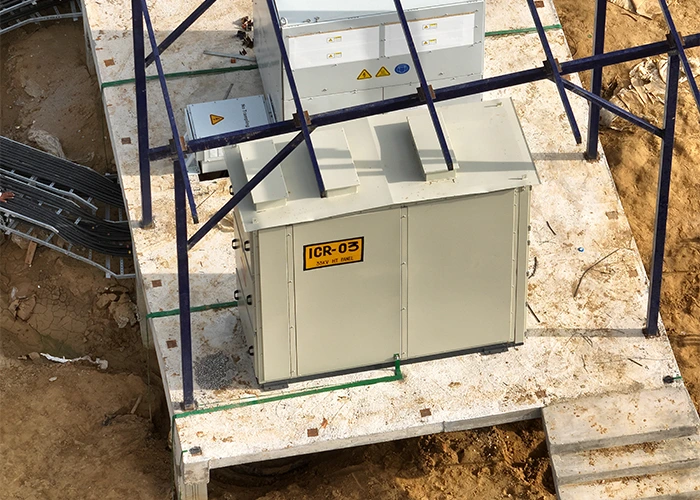
Cable trenching & civil works lag
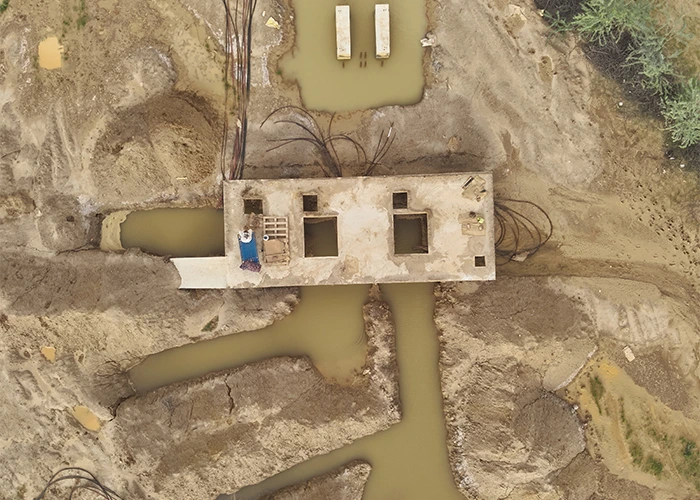
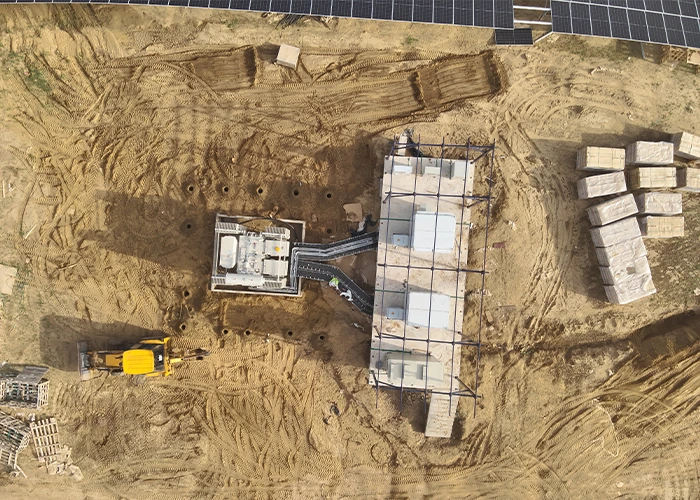
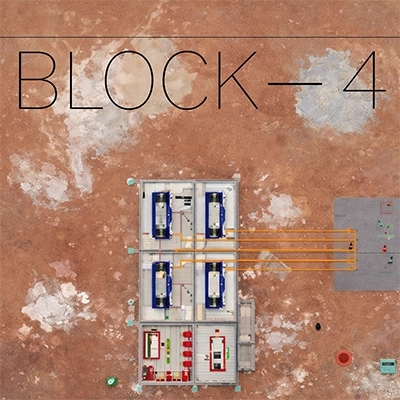
Trench routing and backfill status mapped against the approved layout, including sections left open or waterlogged where civil works trail inverter commissioning.
Site resourcing anomalies
Idle or under-resourced work zones are flagged from aerial imagery visibility a single, hour-long site visit cannot reliably capture across an entire site.
Three Project Scenarios.
A project owner’s drone solar project monitoring report identified module installation in Zones C and D — claimed at 65% complete by the EPC contractor for that billing period — was in fact 41% completion when measured against the flight’s orthomosaic.
Outcomes Achieved
Progress Claimed vs Verified
Weekly aerial monitoring identified pile misalignment in a 12-acre section during Week 3 of structural installation. GPS coordinates and deviation magnitudes were included in the drone data report from the as-built survey overlay.
Outcomes Achieved
Estimated Rework Cost Avoided
An IPP with a 200MW solar project in Andhra Pradesh used bi-weekly drone monitoring reports as primary construction progress evidence for four consecutive lender drawdown tranches, with the project’s independent engineer accepting geo-referenced aerial reports.
Outcomes Achieved
IE Documentation Cycle — Days per Tranche
Operational Benefits by Stakeholder
Fewer site visits, same oversight
Weekly or fortnightly aerial data cuts how often teams travel to confirm status.
Shared billing-dispute reference
A dated orthomosaic replaces two competing completion estimates with one measured document.
Remote portfolio visibility
Compare completion across multi-state sites from one report set, without travel.
MNRE/SECI documentation
A timestamped record supports deadline-extension applications by showing exactly where delays originated.
Earlier schedule-risk detection
A lag caught at week two is a conversation; caught at week six it's a milestone risk.
Lender-ready verification
Georeferenced overlays give an IE a spatial reference to check tranche claims against.
Drone-Based Solar Project Progress Monitoring
Our Amazing Clients






















Who This Service Is Built For
EPC Project Managers & Directors
Get an objective figure to check subcontractor-claimed completion against before certifying a payment milestone.
IPP & Developer Project Teams
Compare status across a multi-state portfolio from one standardized report format.
Lenders & Independent Engineers
Check EPC claims against a spatial document rather than narrative updates alone.
Project Owners Managing EPC Contracts
Use a dated orthomosaic as a shared reference when a contractor’s billing claim diverges from the owner’s assessment.
Deliverables From Every Monitoring Survey
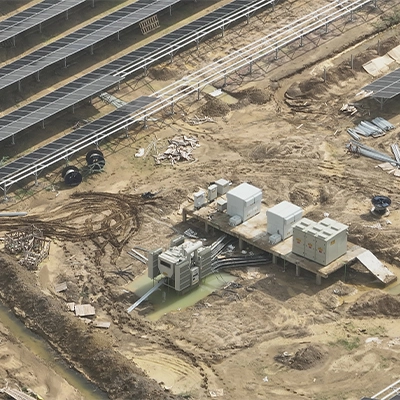
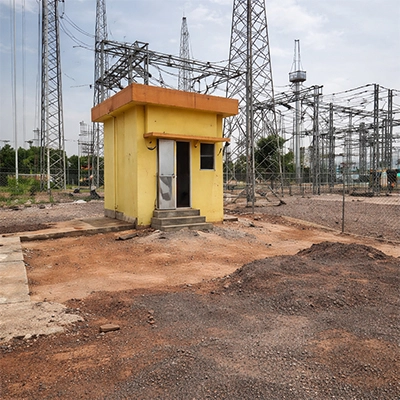
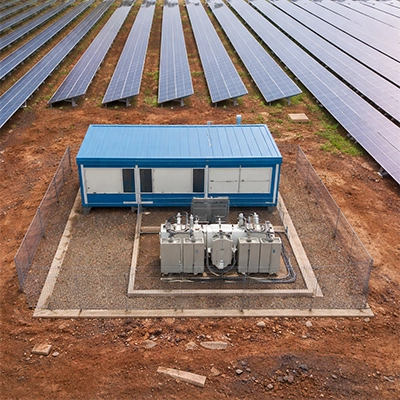
Request a Site-Specific Progress Monitoring Proposal
Phone/ Whatsapp
+91 78457 26375
Email Us
sales@lesoko.in
Head Office
Request Monitoring Quote
Frequently Asked Questions
A recurring aerial survey and reporting service for active solar construction sites. DGCA-certified pilots capture georeferenced imagery at defined intervals, processed into orthomosaic maps and compared against the approved layout to produce a planned-versus-actual completion percentage by construction zone.
Fortnightly cadence suits most lender reporting cycles and EPC milestone schedules. Weekly surveys suit tight SECI/MNRE deadlines or active billing disputes; distributed or slower-moving sites are typically monitored monthly.
A manual walk-through covers whatever fraction of a large site the inspector can reach and produces a subjective estimate. A drone survey covers the full footprint in a single mobilisation and produces a georeferenced dataset directly comparable against any prior survey date.
Yes. Under India’s Drone Rules 2021, commercial operations require the pilot to hold a valid DGCA Remote Pilot Certificate and the drone to carry a UIN, with clearance secured through DigitalSky. Lesoko’s pilots hold current DGCA RPC accreditation for every commercial engagement.
A georeferenced orthomosaic, a planned-versus-actual overlay with zone-wise percentages, GPS-tagged annotated imagery, and a milestone progress report in PDF. Optional add-ons include 3D point cloud modelling and cut-and-fill volumetric analysis, delivered within 48 hours in AutoCAD/GIS-compatible formats.
Regular surveys produce an objective, timestamped record. A lag caught at week two is a scheduling adjustment; caught only at a monthly review, it’s a risk against an MNRE or SECI deadline. The verified timeline also supports formal deadline-extension applications where required.
A site boundary file (KML/KMZ) or coordinates, total capacity and approximate area, current construction stage, target monitoring frequency, and any lender/IE reporting format requirements.
A formal Non-Disclosure Agreement is a contractual default on every engagement. Site coordinates, progress data, and commercial information are treated as confidential by default, not as an optional add-on.
Yes. A documented, timestamped construction timeline showing exactly where and when delays originated is commonly used to support formal extension applications, alongside routine milestone reporting.
GeoTIFF orthomosaics, DXF/SHP vector exports for AutoCAD and GIS platforms, and PDF reports compatible with most engineering and project-management software already in use on EPC teams.