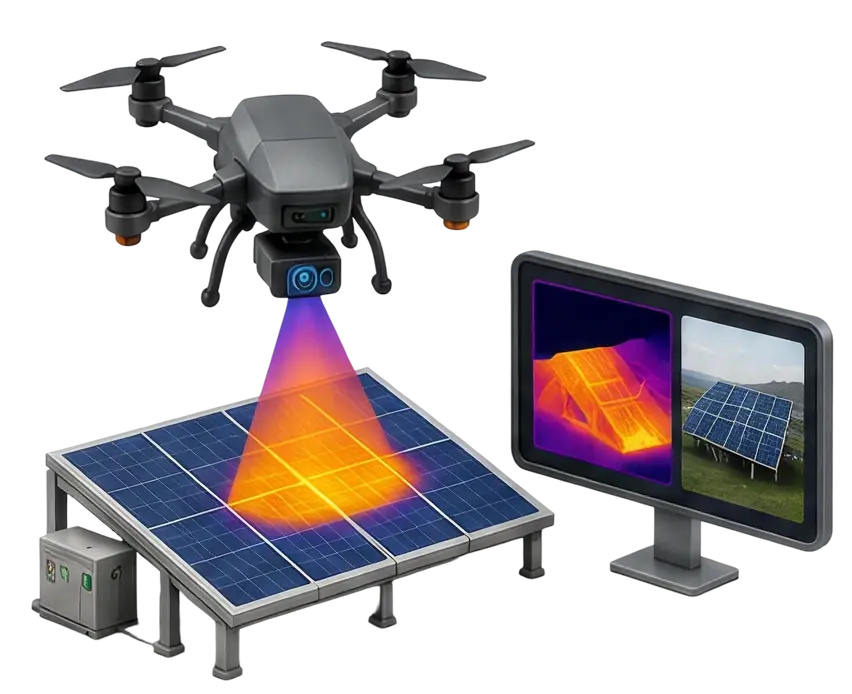
Drone Inspection & Asset Intelligence
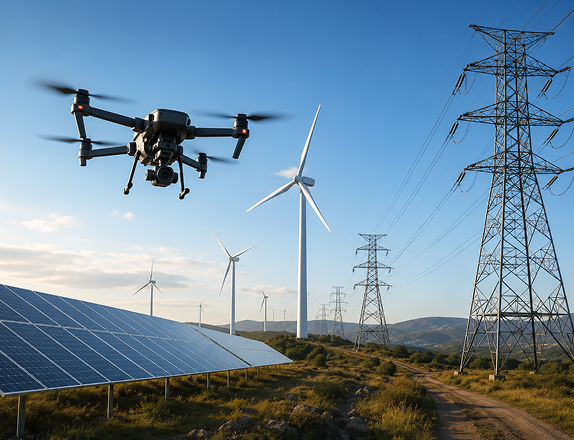
Detect defects across solar panels, transmission lines, wind turbines and industrial assets without manual climbs or shutdowns.
Lesoko transforms aerial, thermal and geospatial data into decision-ready intelligence for critical infrastructure across India.

























Every service below covers the full cycle: flight planning, data acquisition, in-house processing and final reporting configurable for a single asset audit or a recurring pan-India monitoring program.
Detect defects across solar panels, transmission lines, wind turbines and industrial assets without manual climbs or shutdowns.
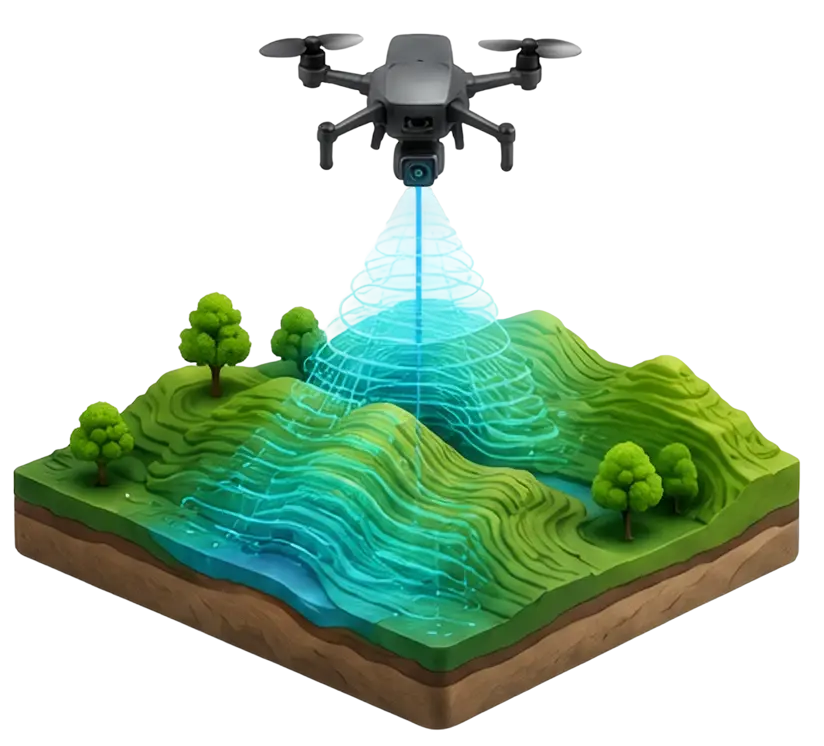
Build survey-grade orthomosaics and terrain data for engineering, planning and design teams.
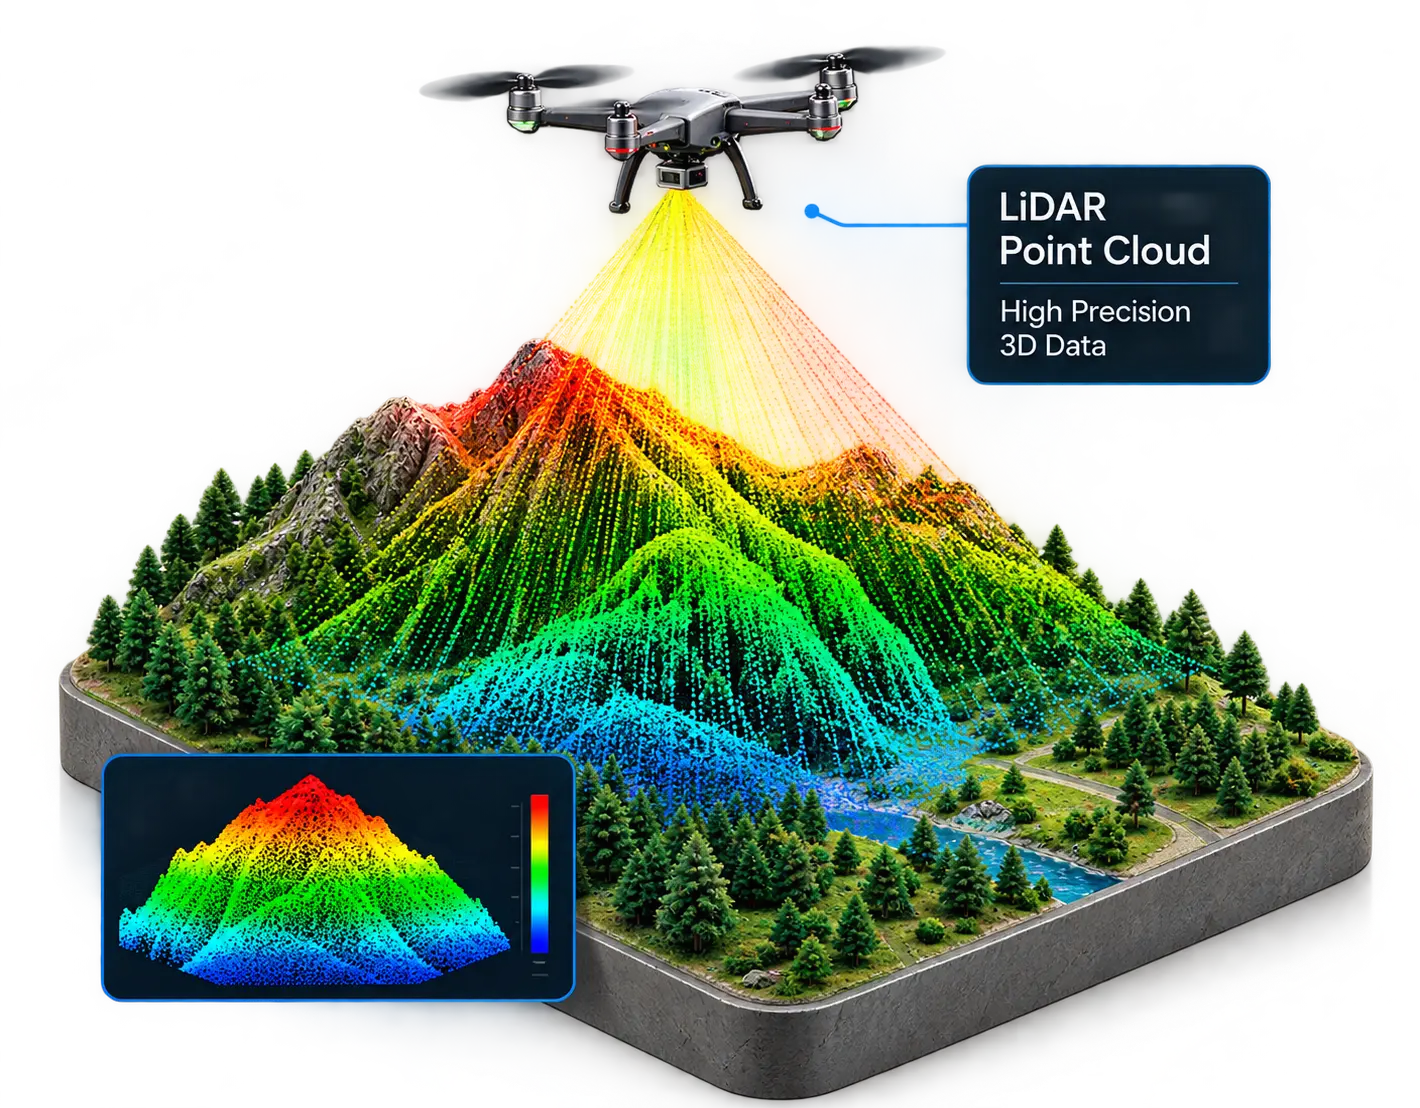
Capture high-density LiDAR, 3D models and hi-res imagery for engineering, planning and documentation.
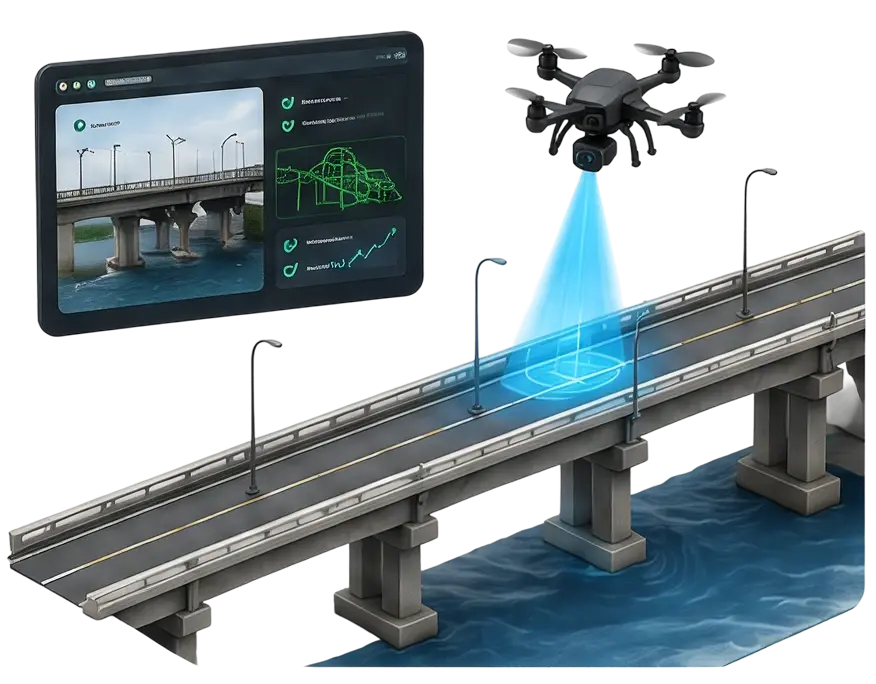
Verify real construction milestones for stakeholders without a single site visit.
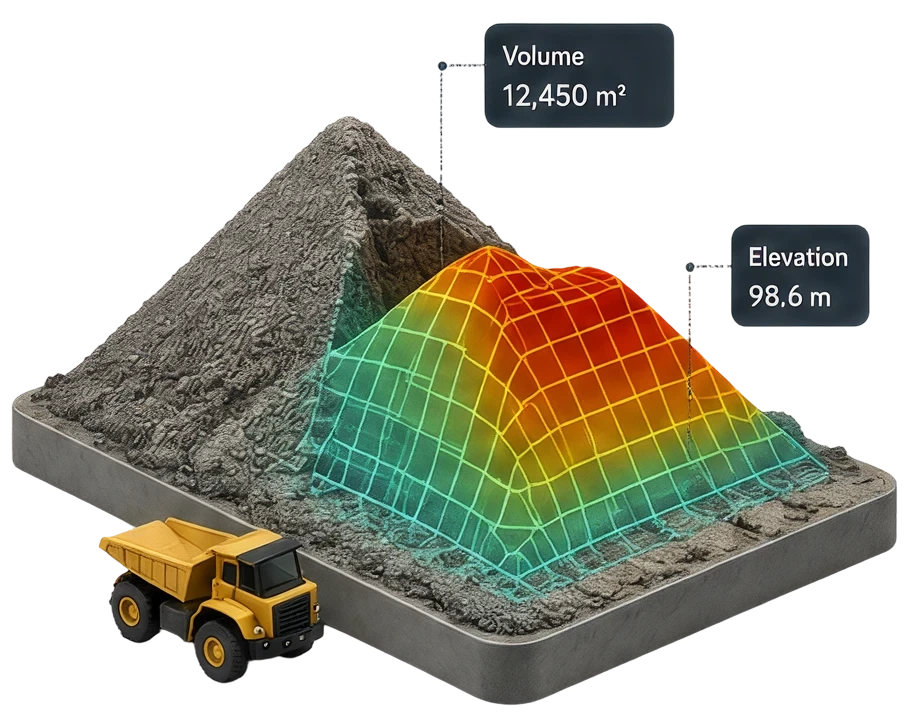
Measure material movement accurately enough to support inventory control and billing.
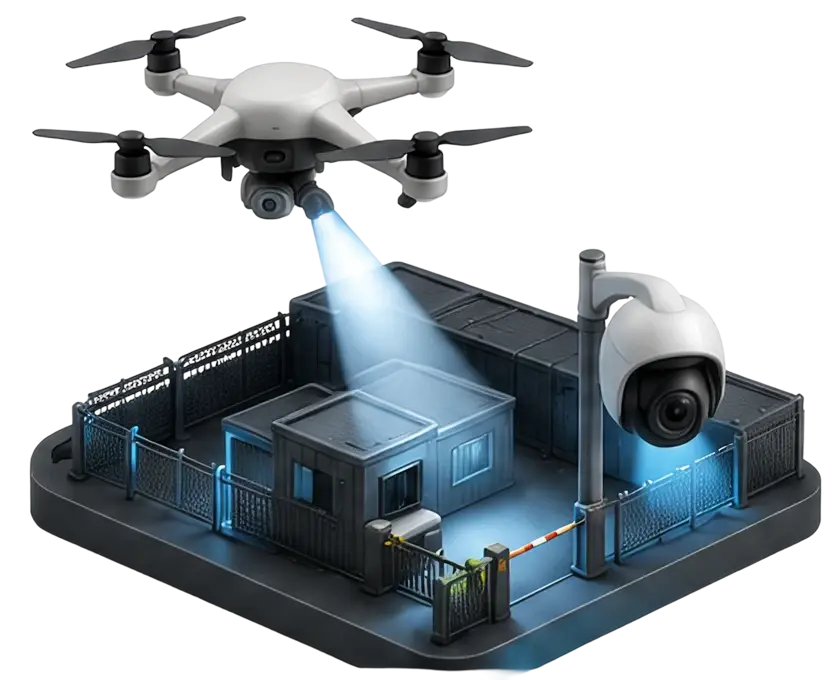
Remotely supervise site activity and safety compliance across remote or hazardous assets.
Drag each slider to see the same site move from raw aerial capture to an engineering-ready deliverable.
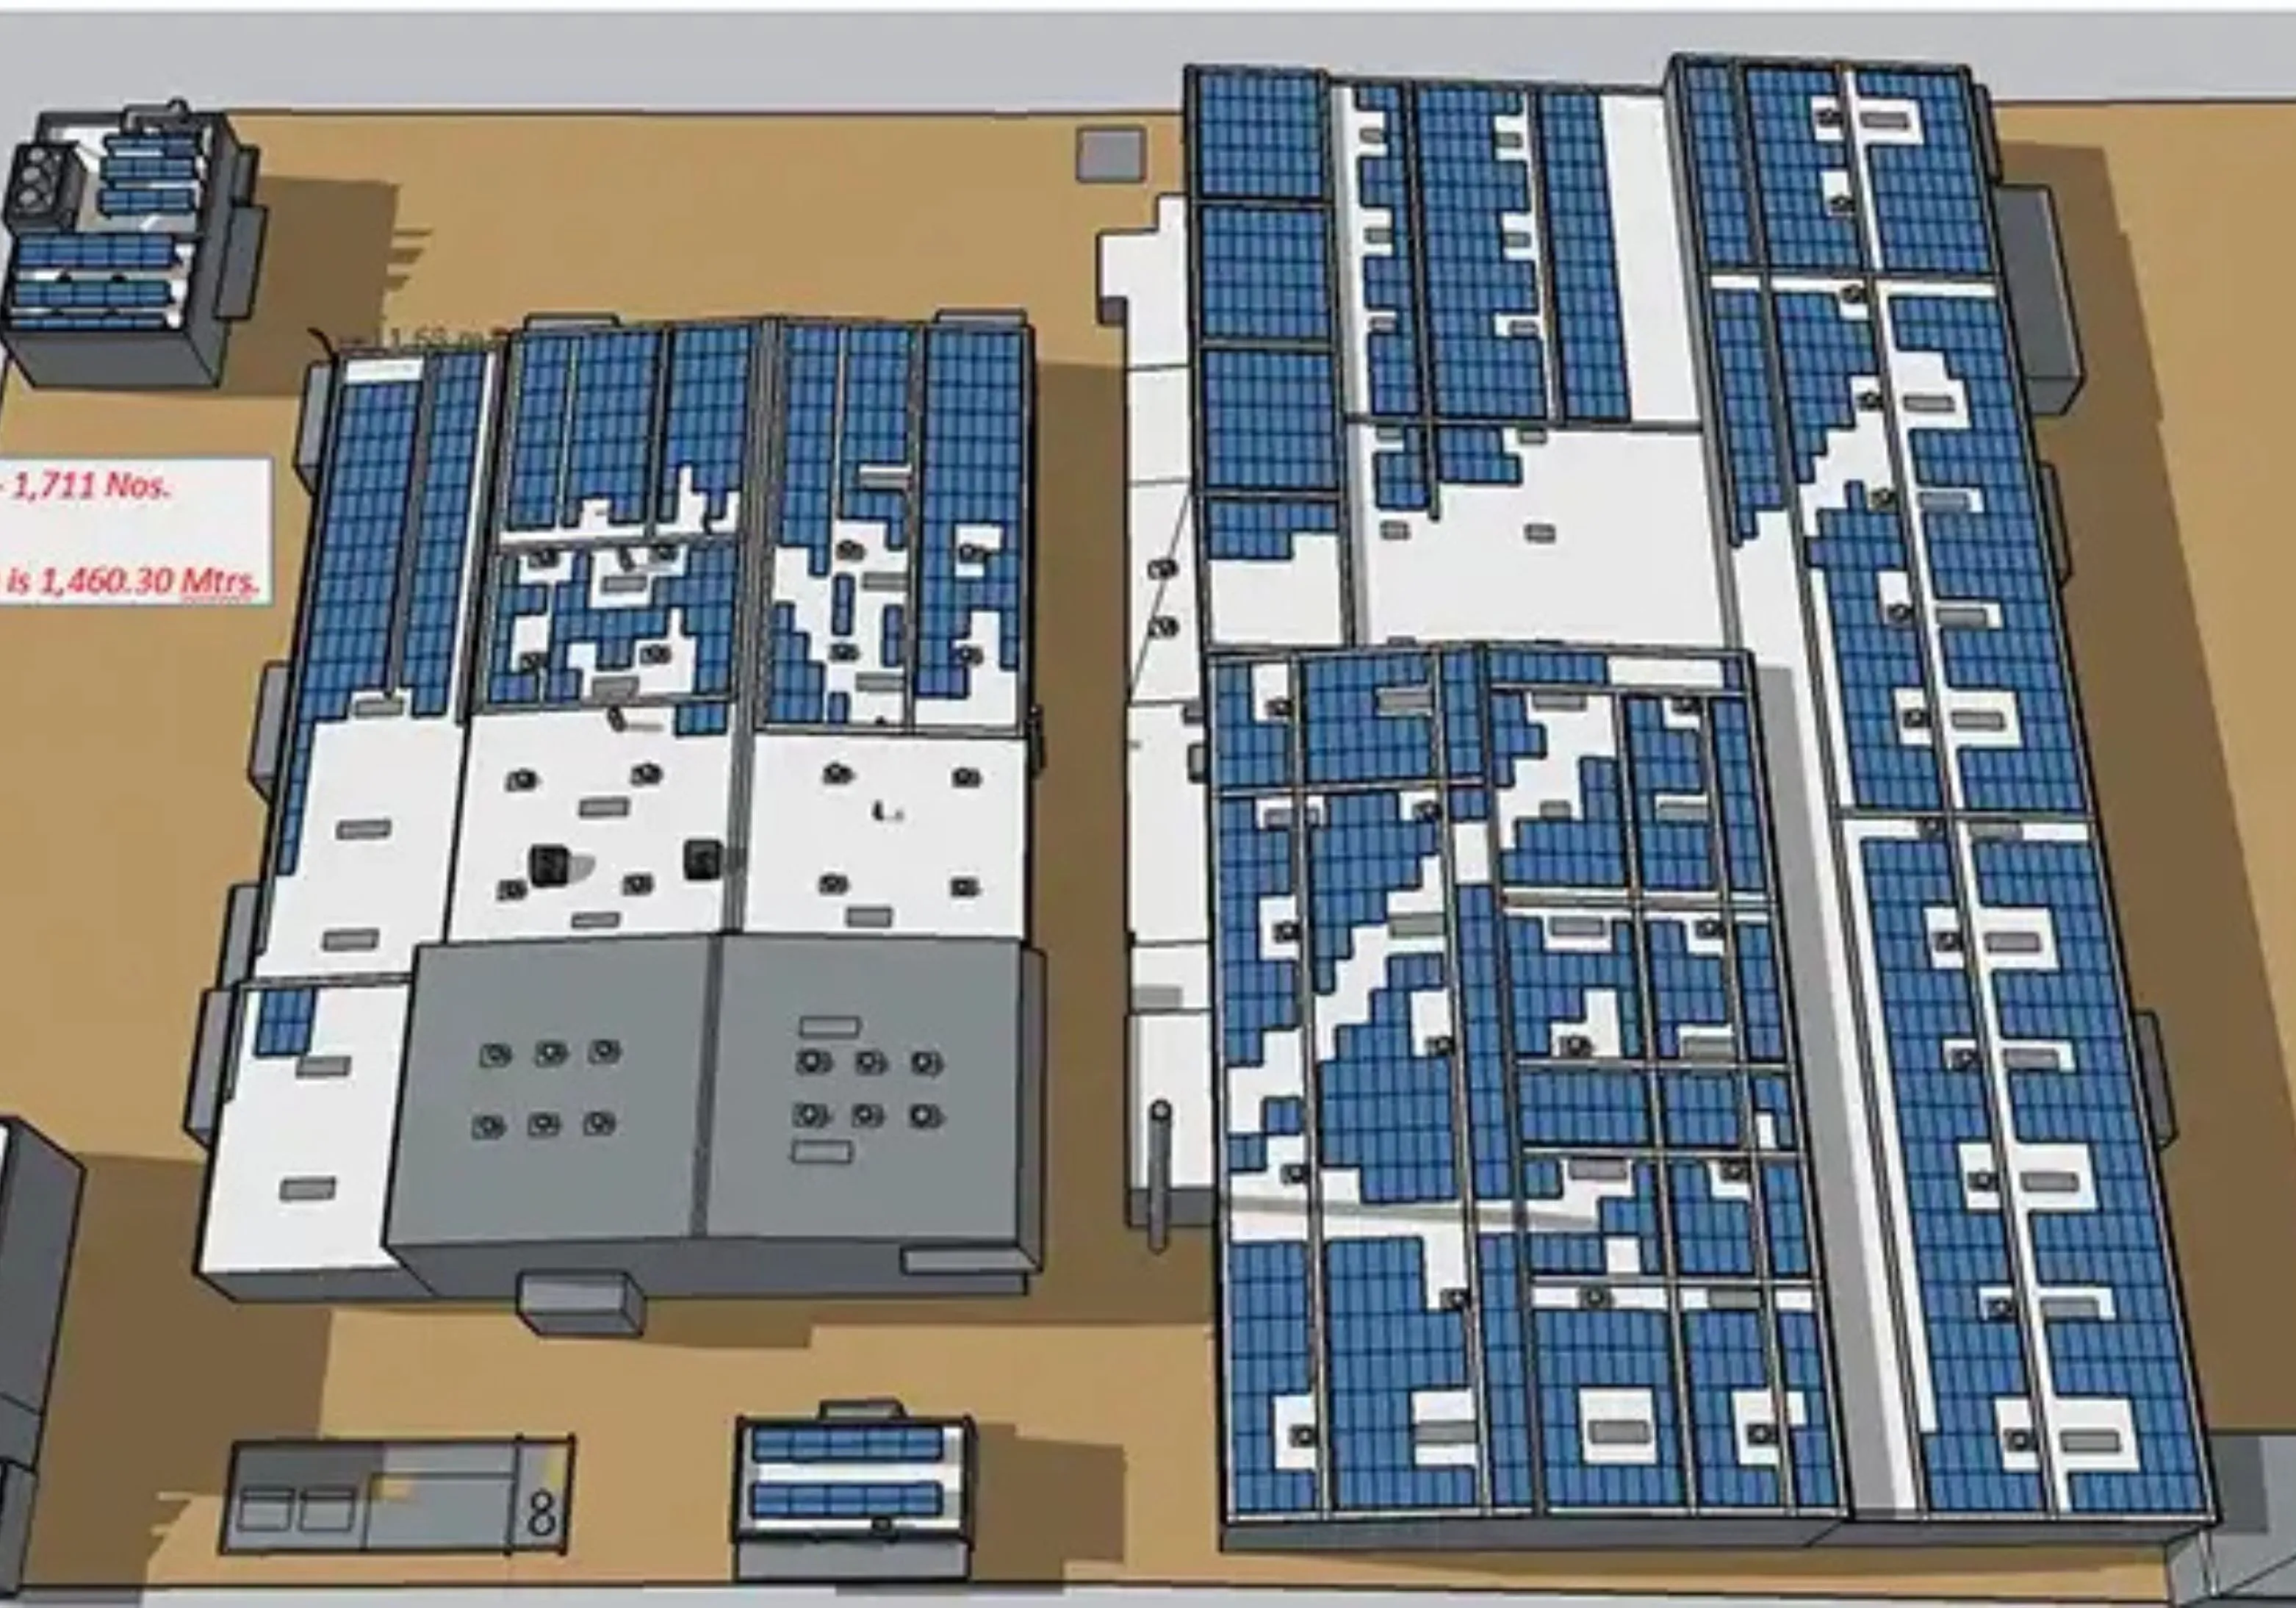 AUTOCAD 2D/3D
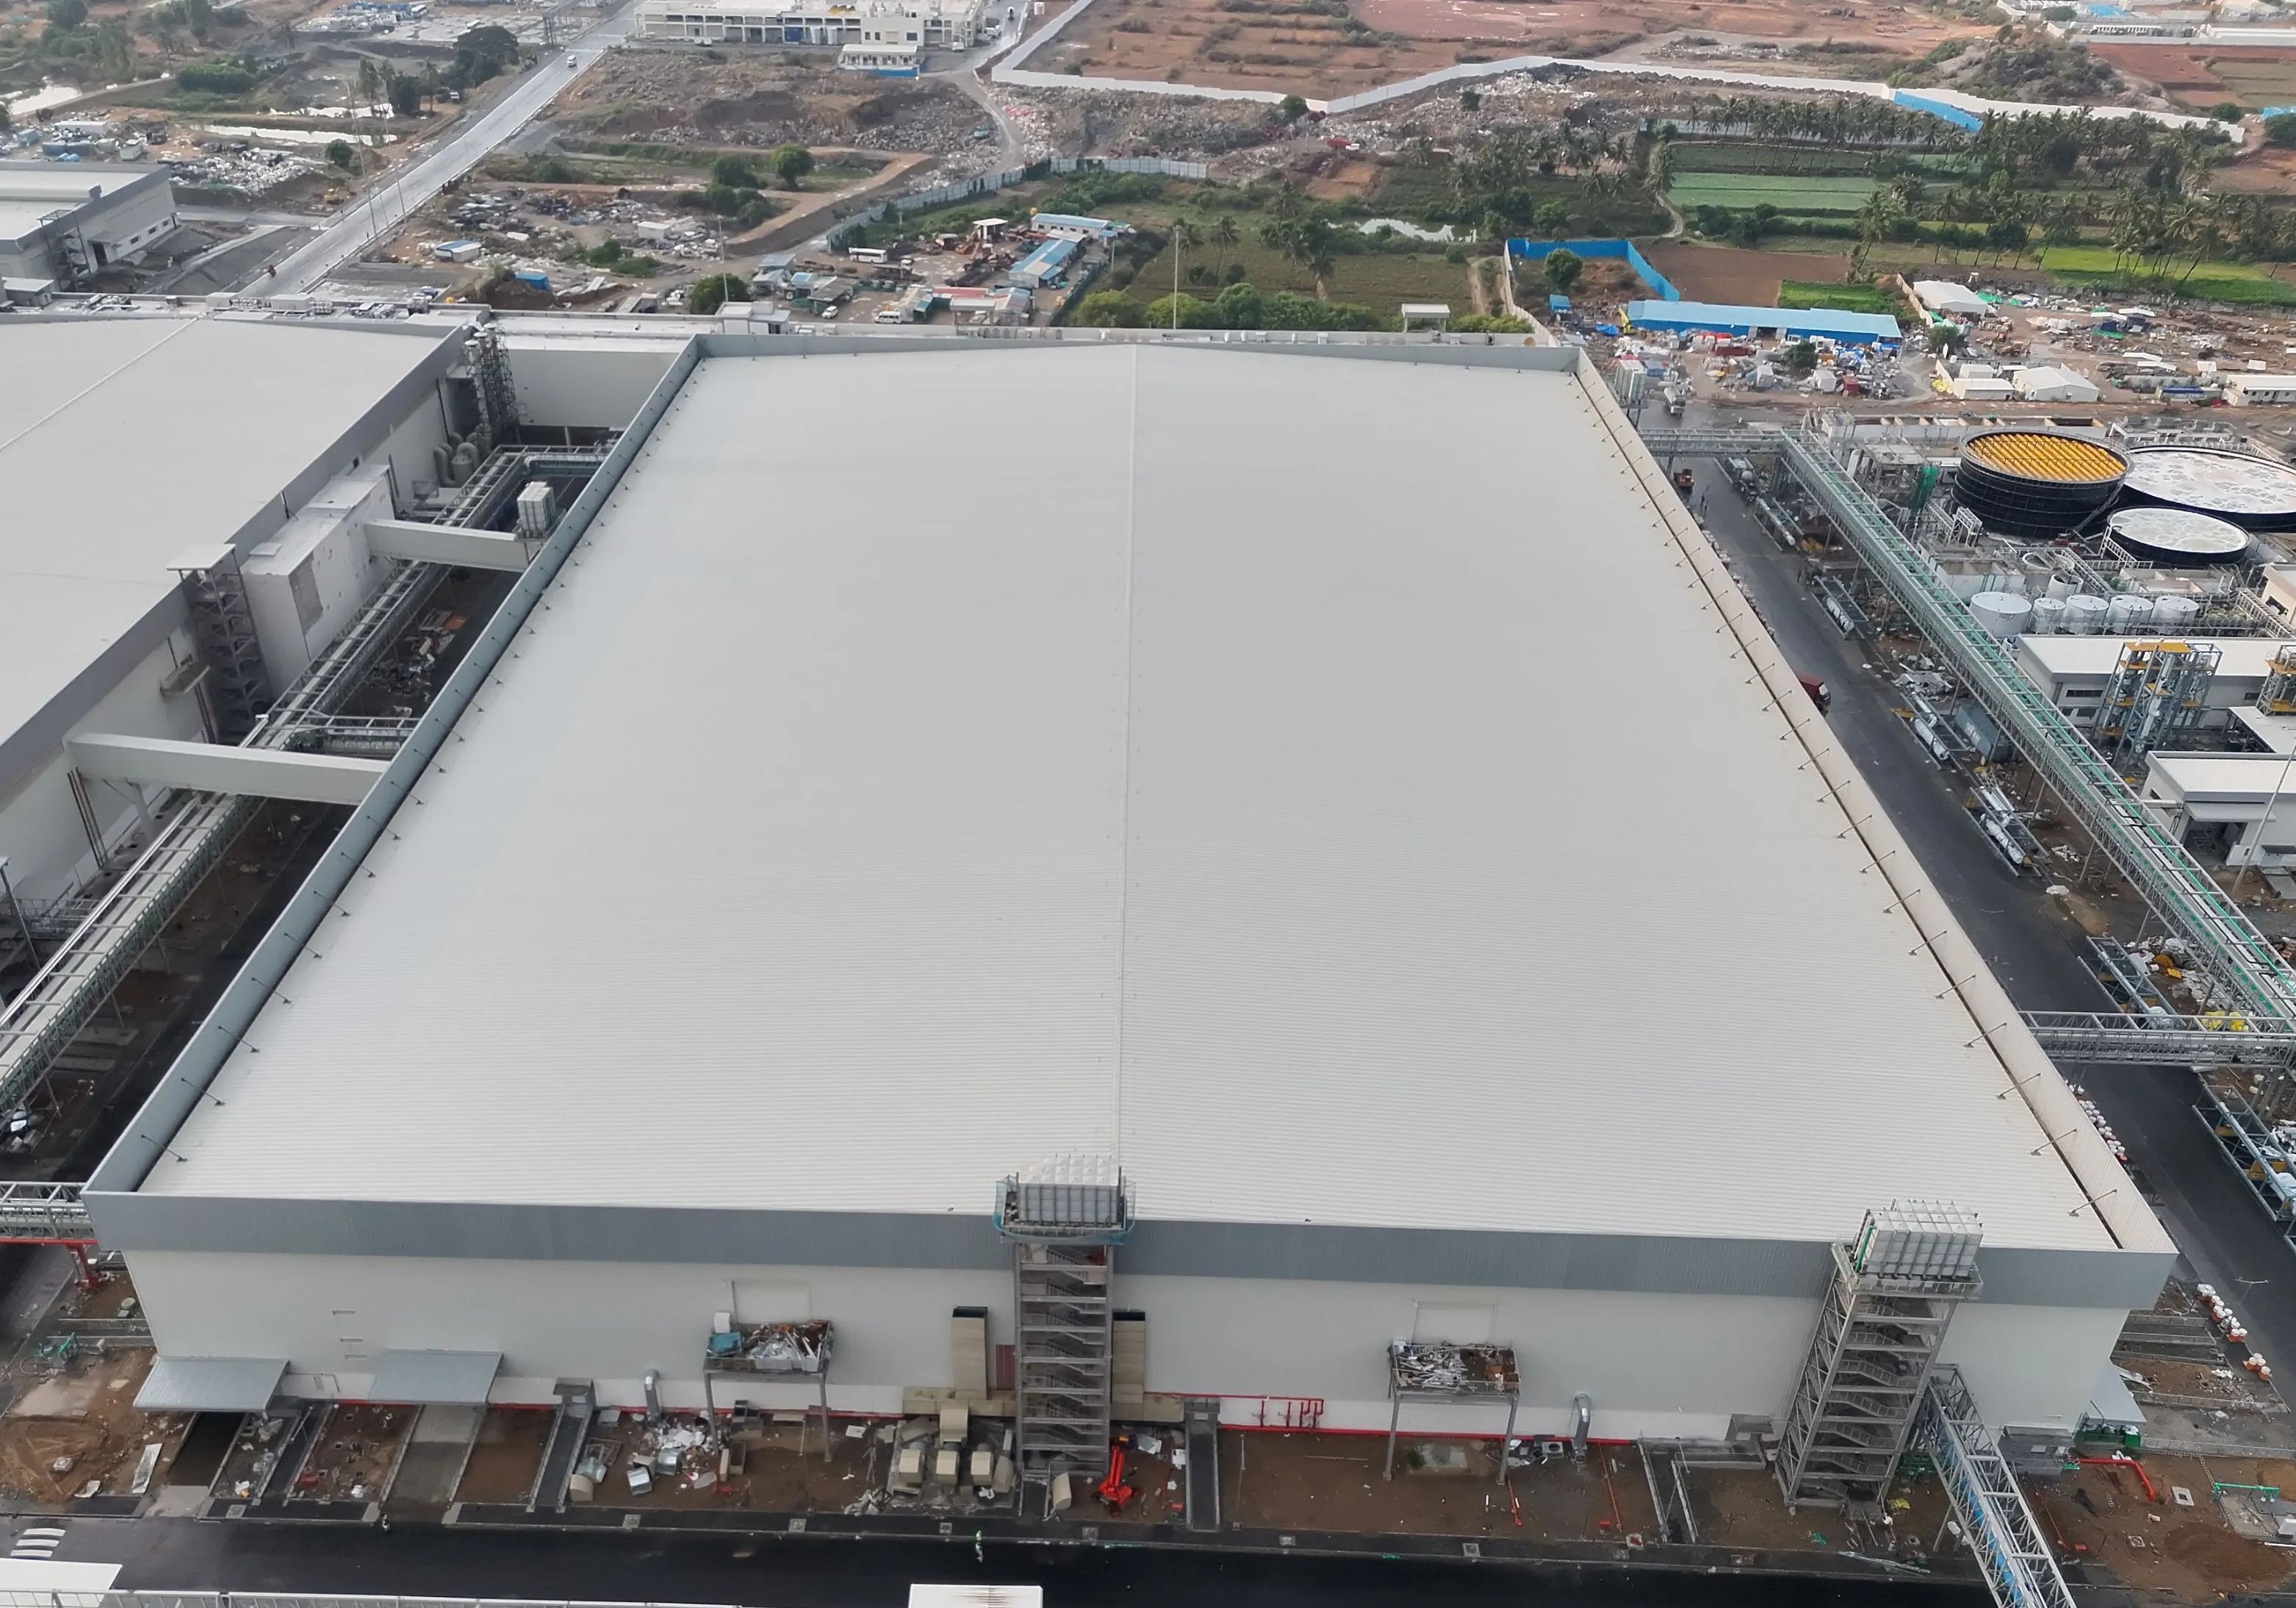 RAW AERIAL DATA
High-overlap RGB imagery becomes a CAD-ready site model for structural and foundation design.
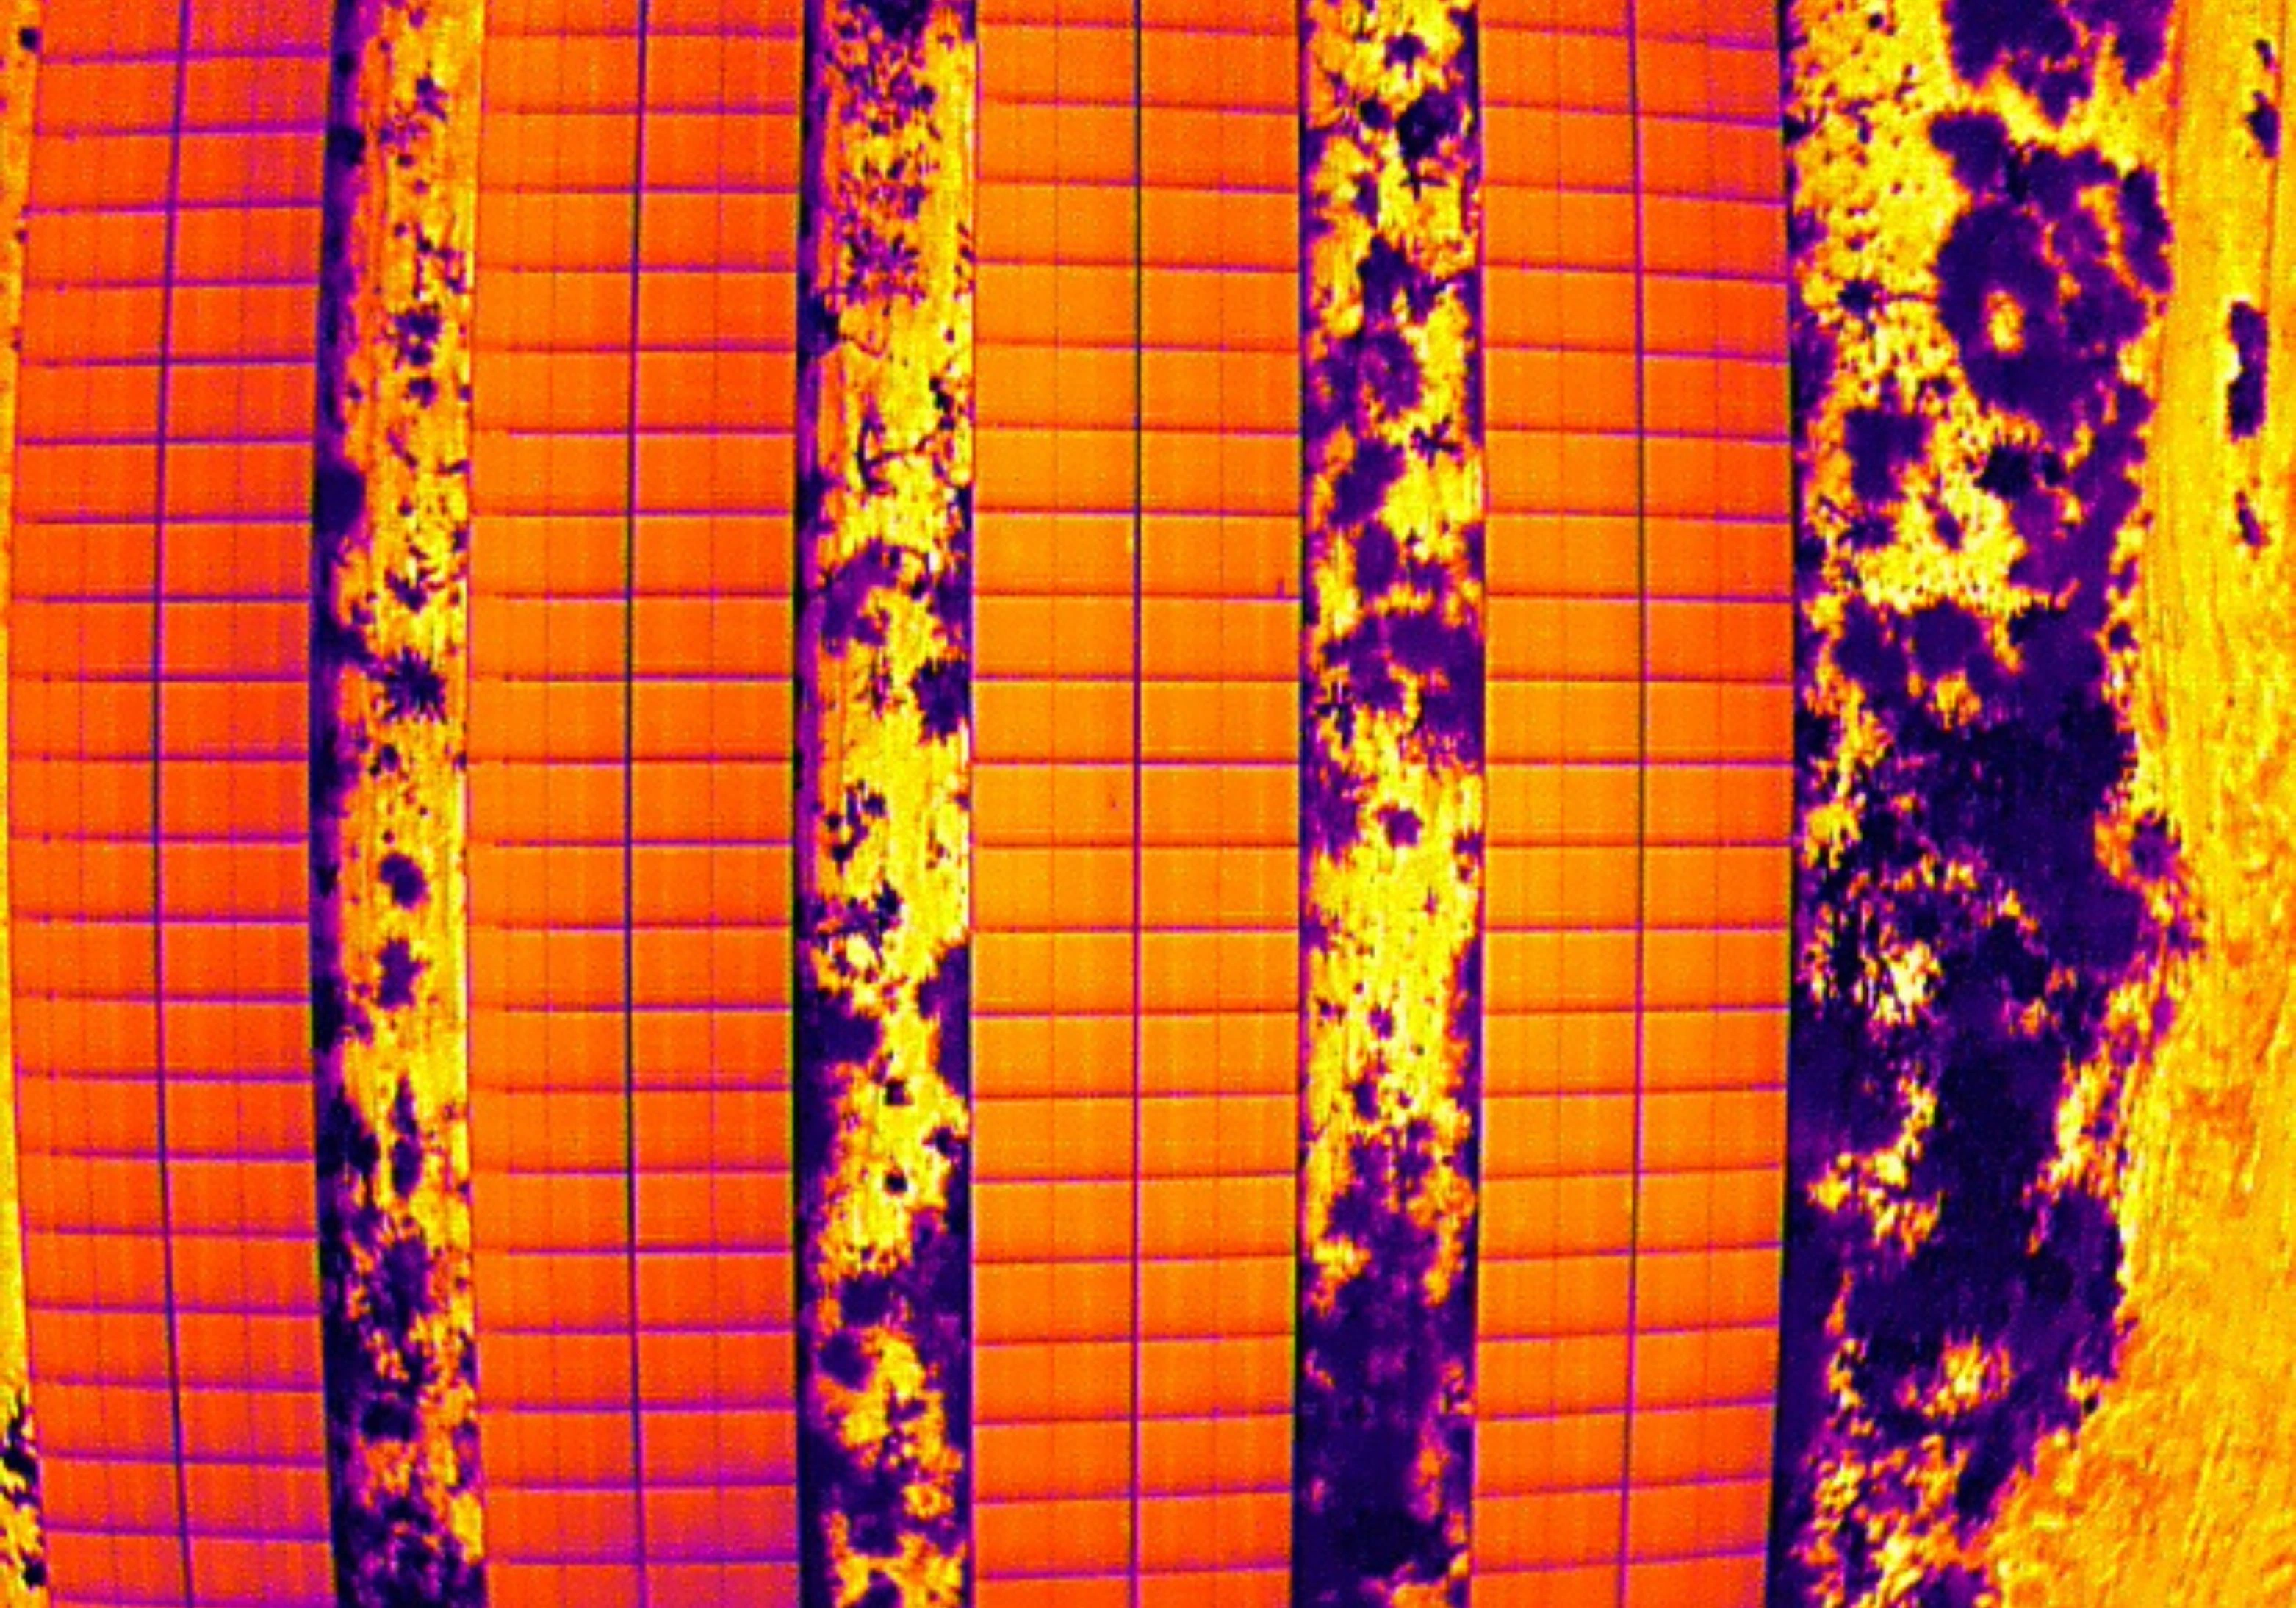 TAGGED DEFECT MAP
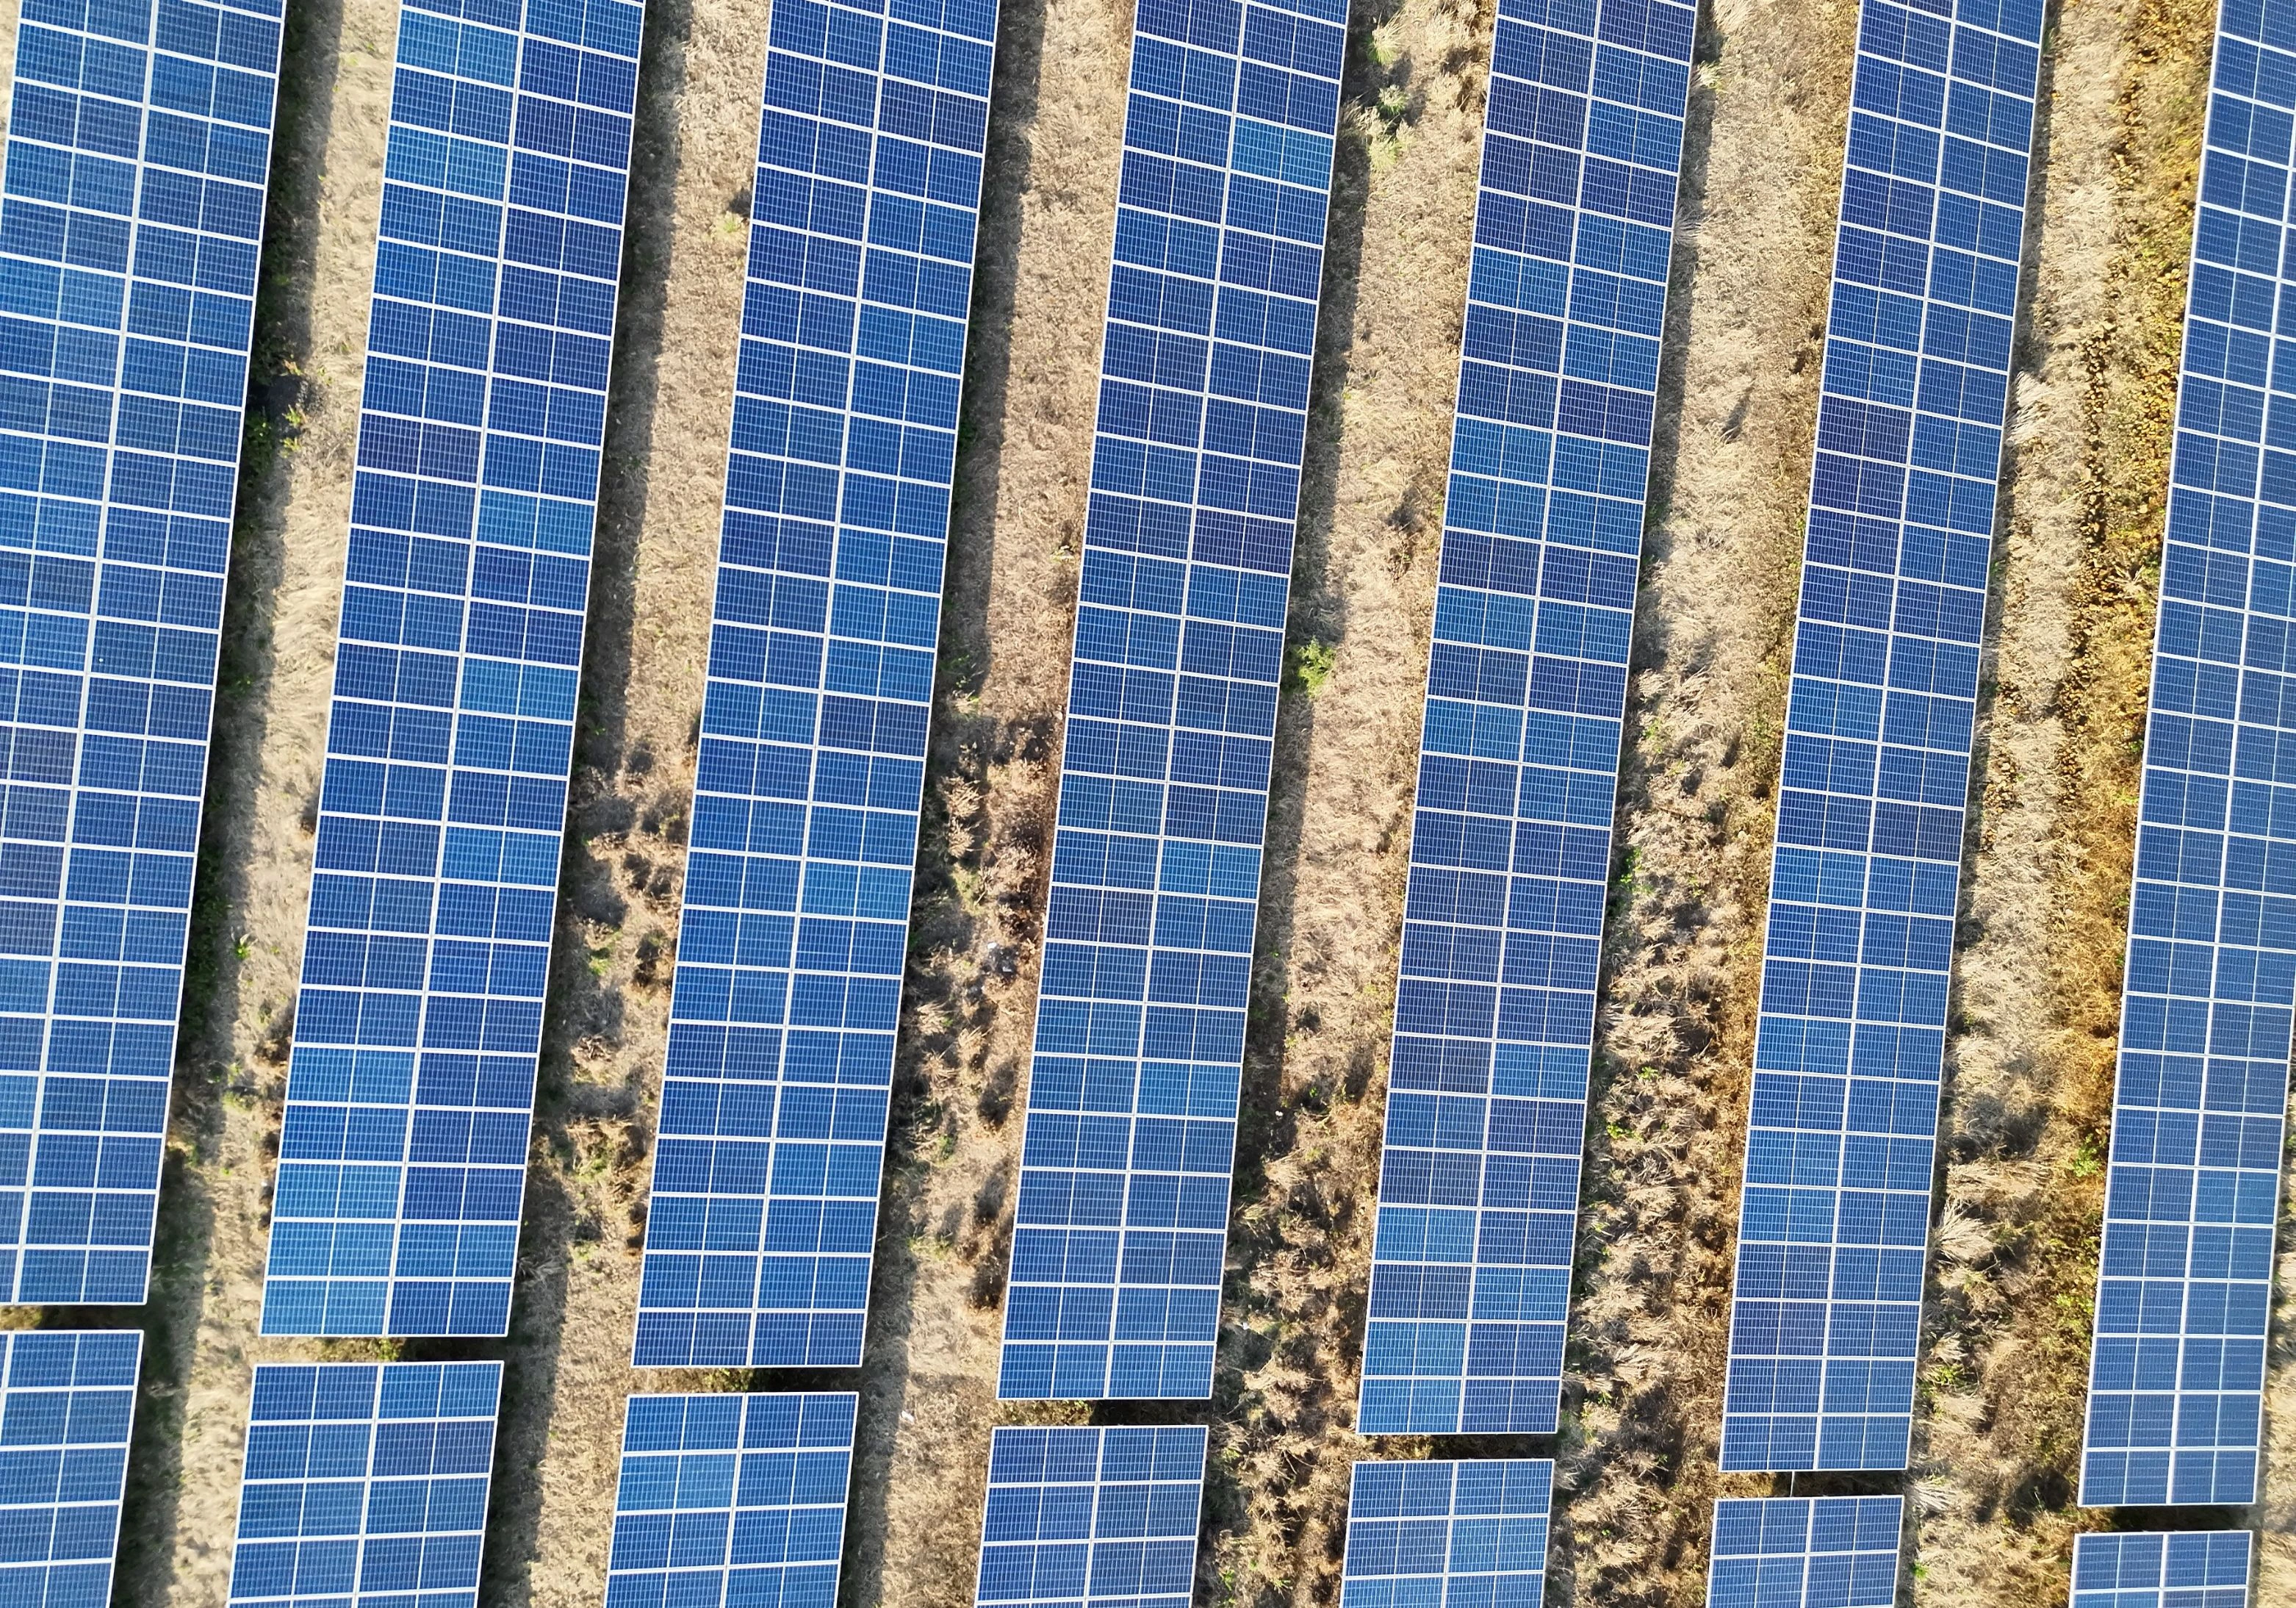 THERMAL IMAGERY
Radiometric captures resolve into an interactive dashboard defect list, ready to dispatch.
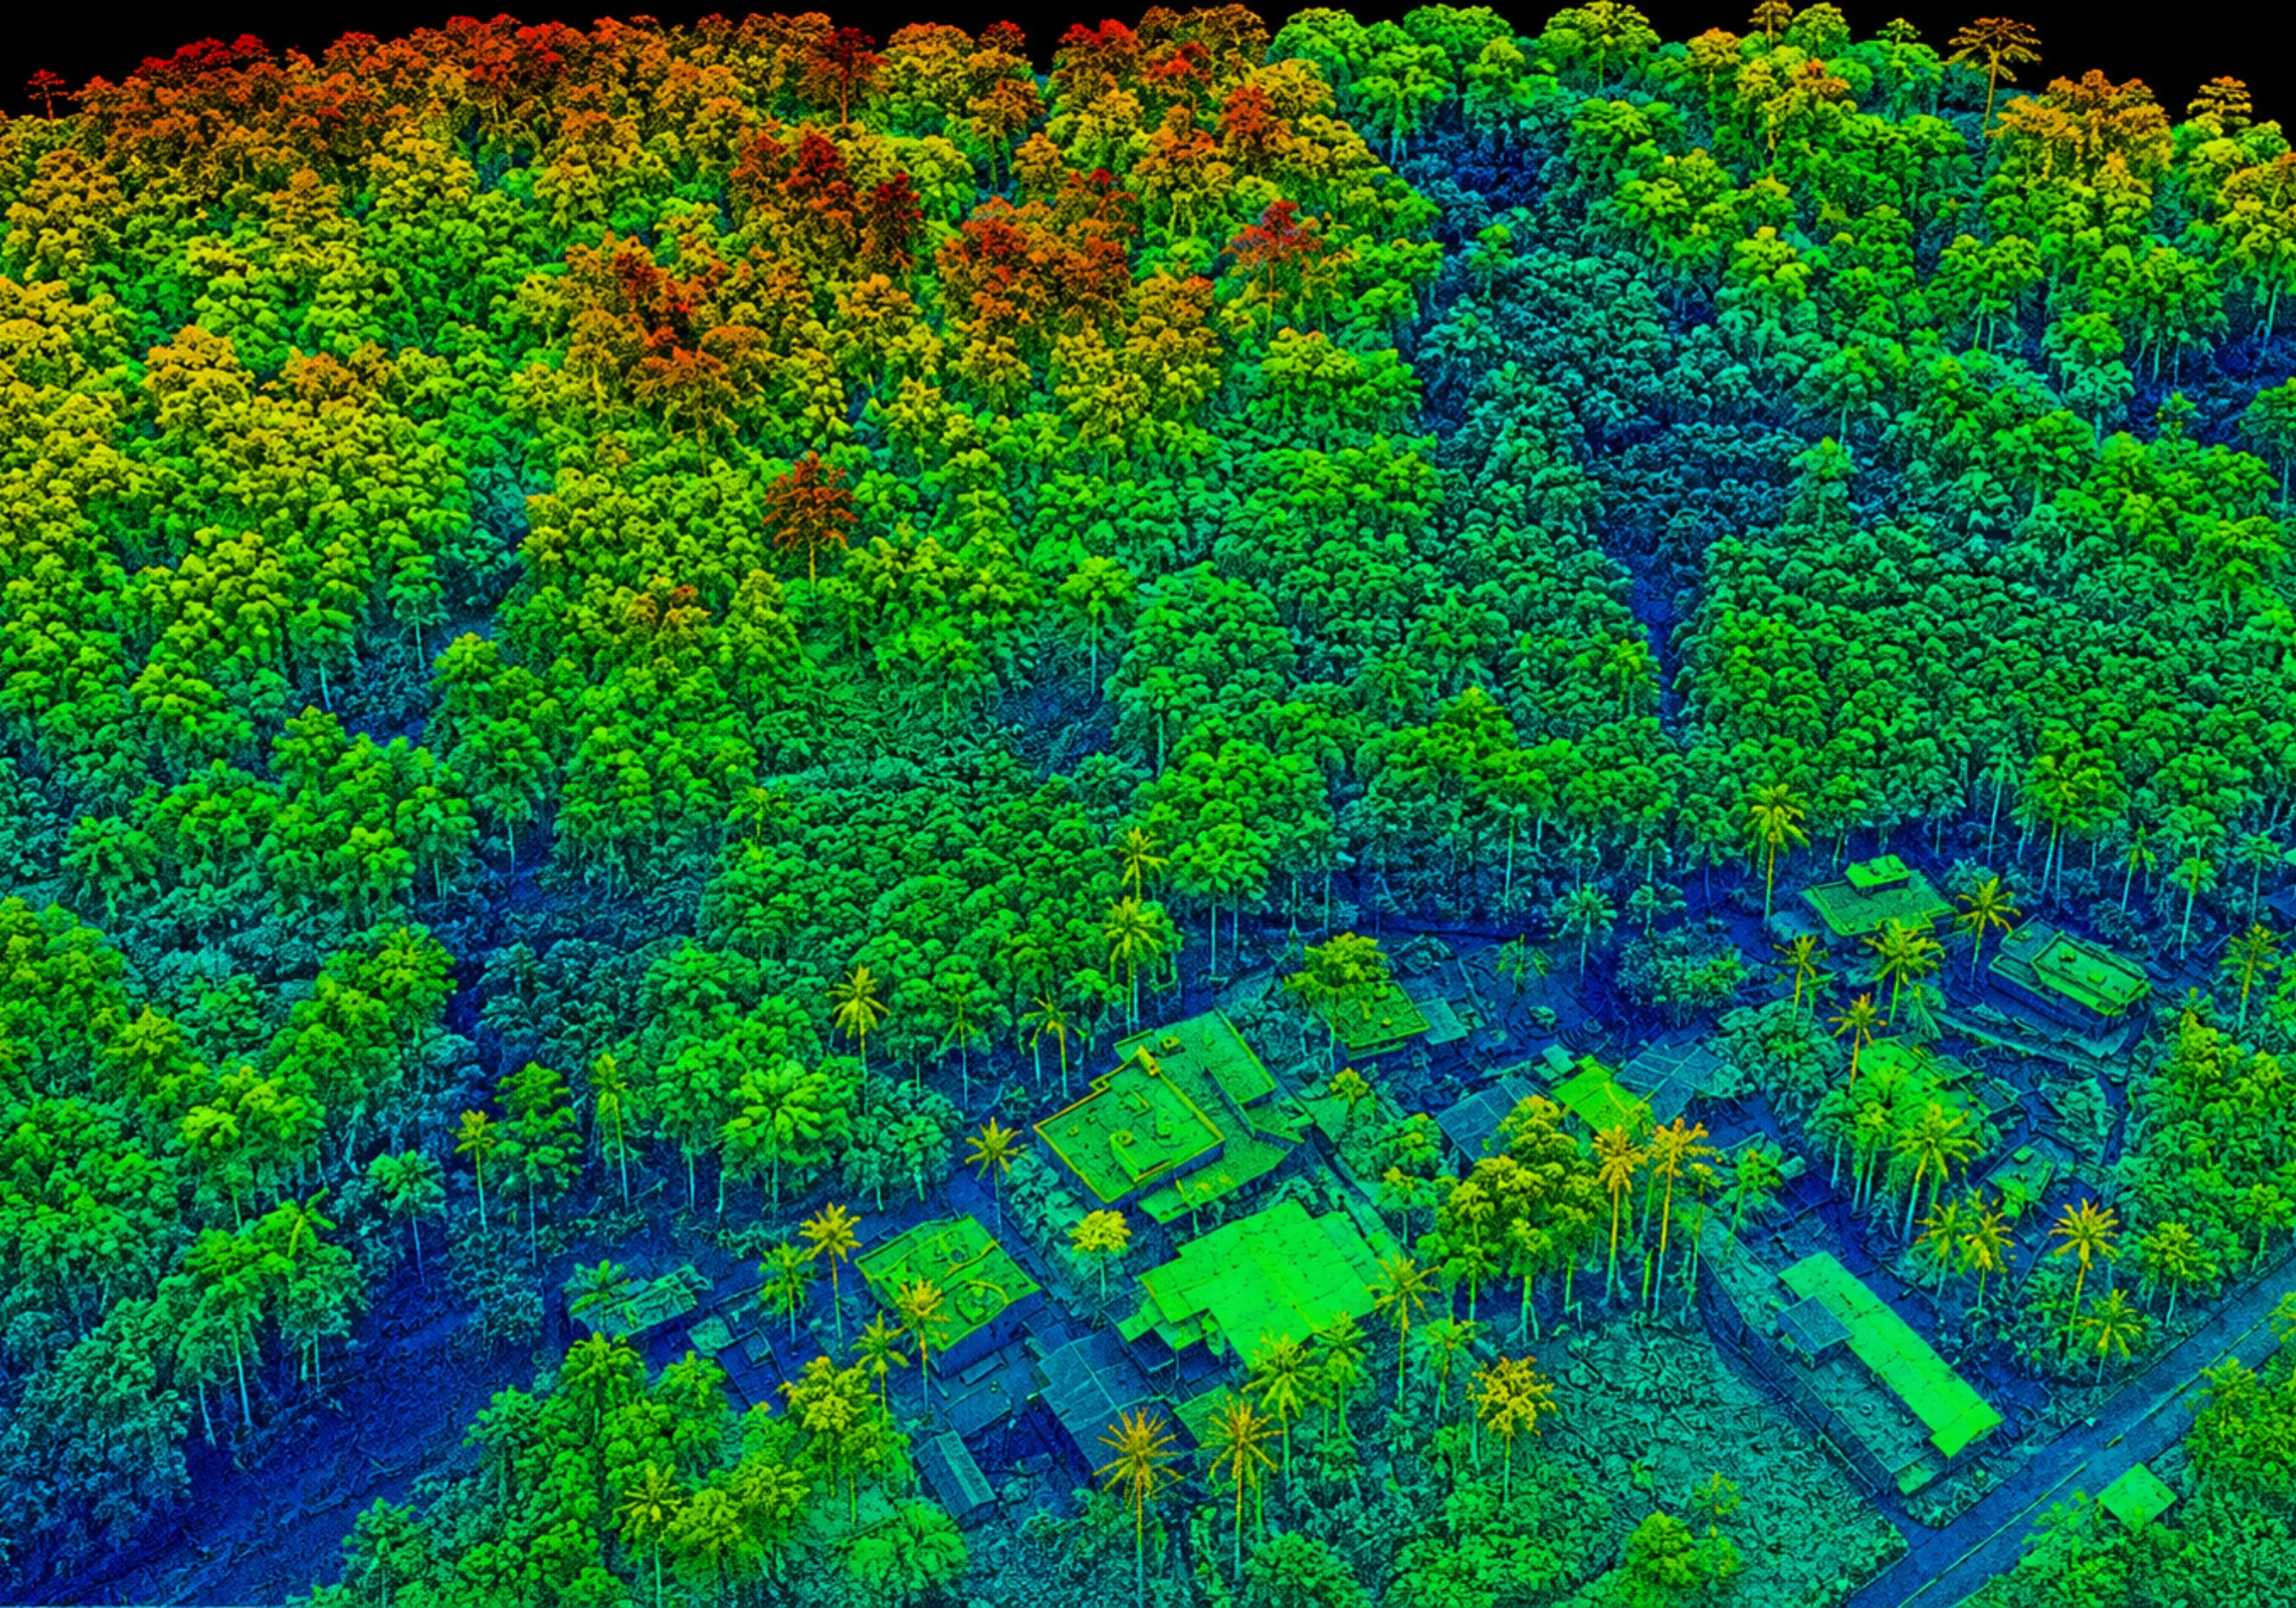 DEM & CONTOURS
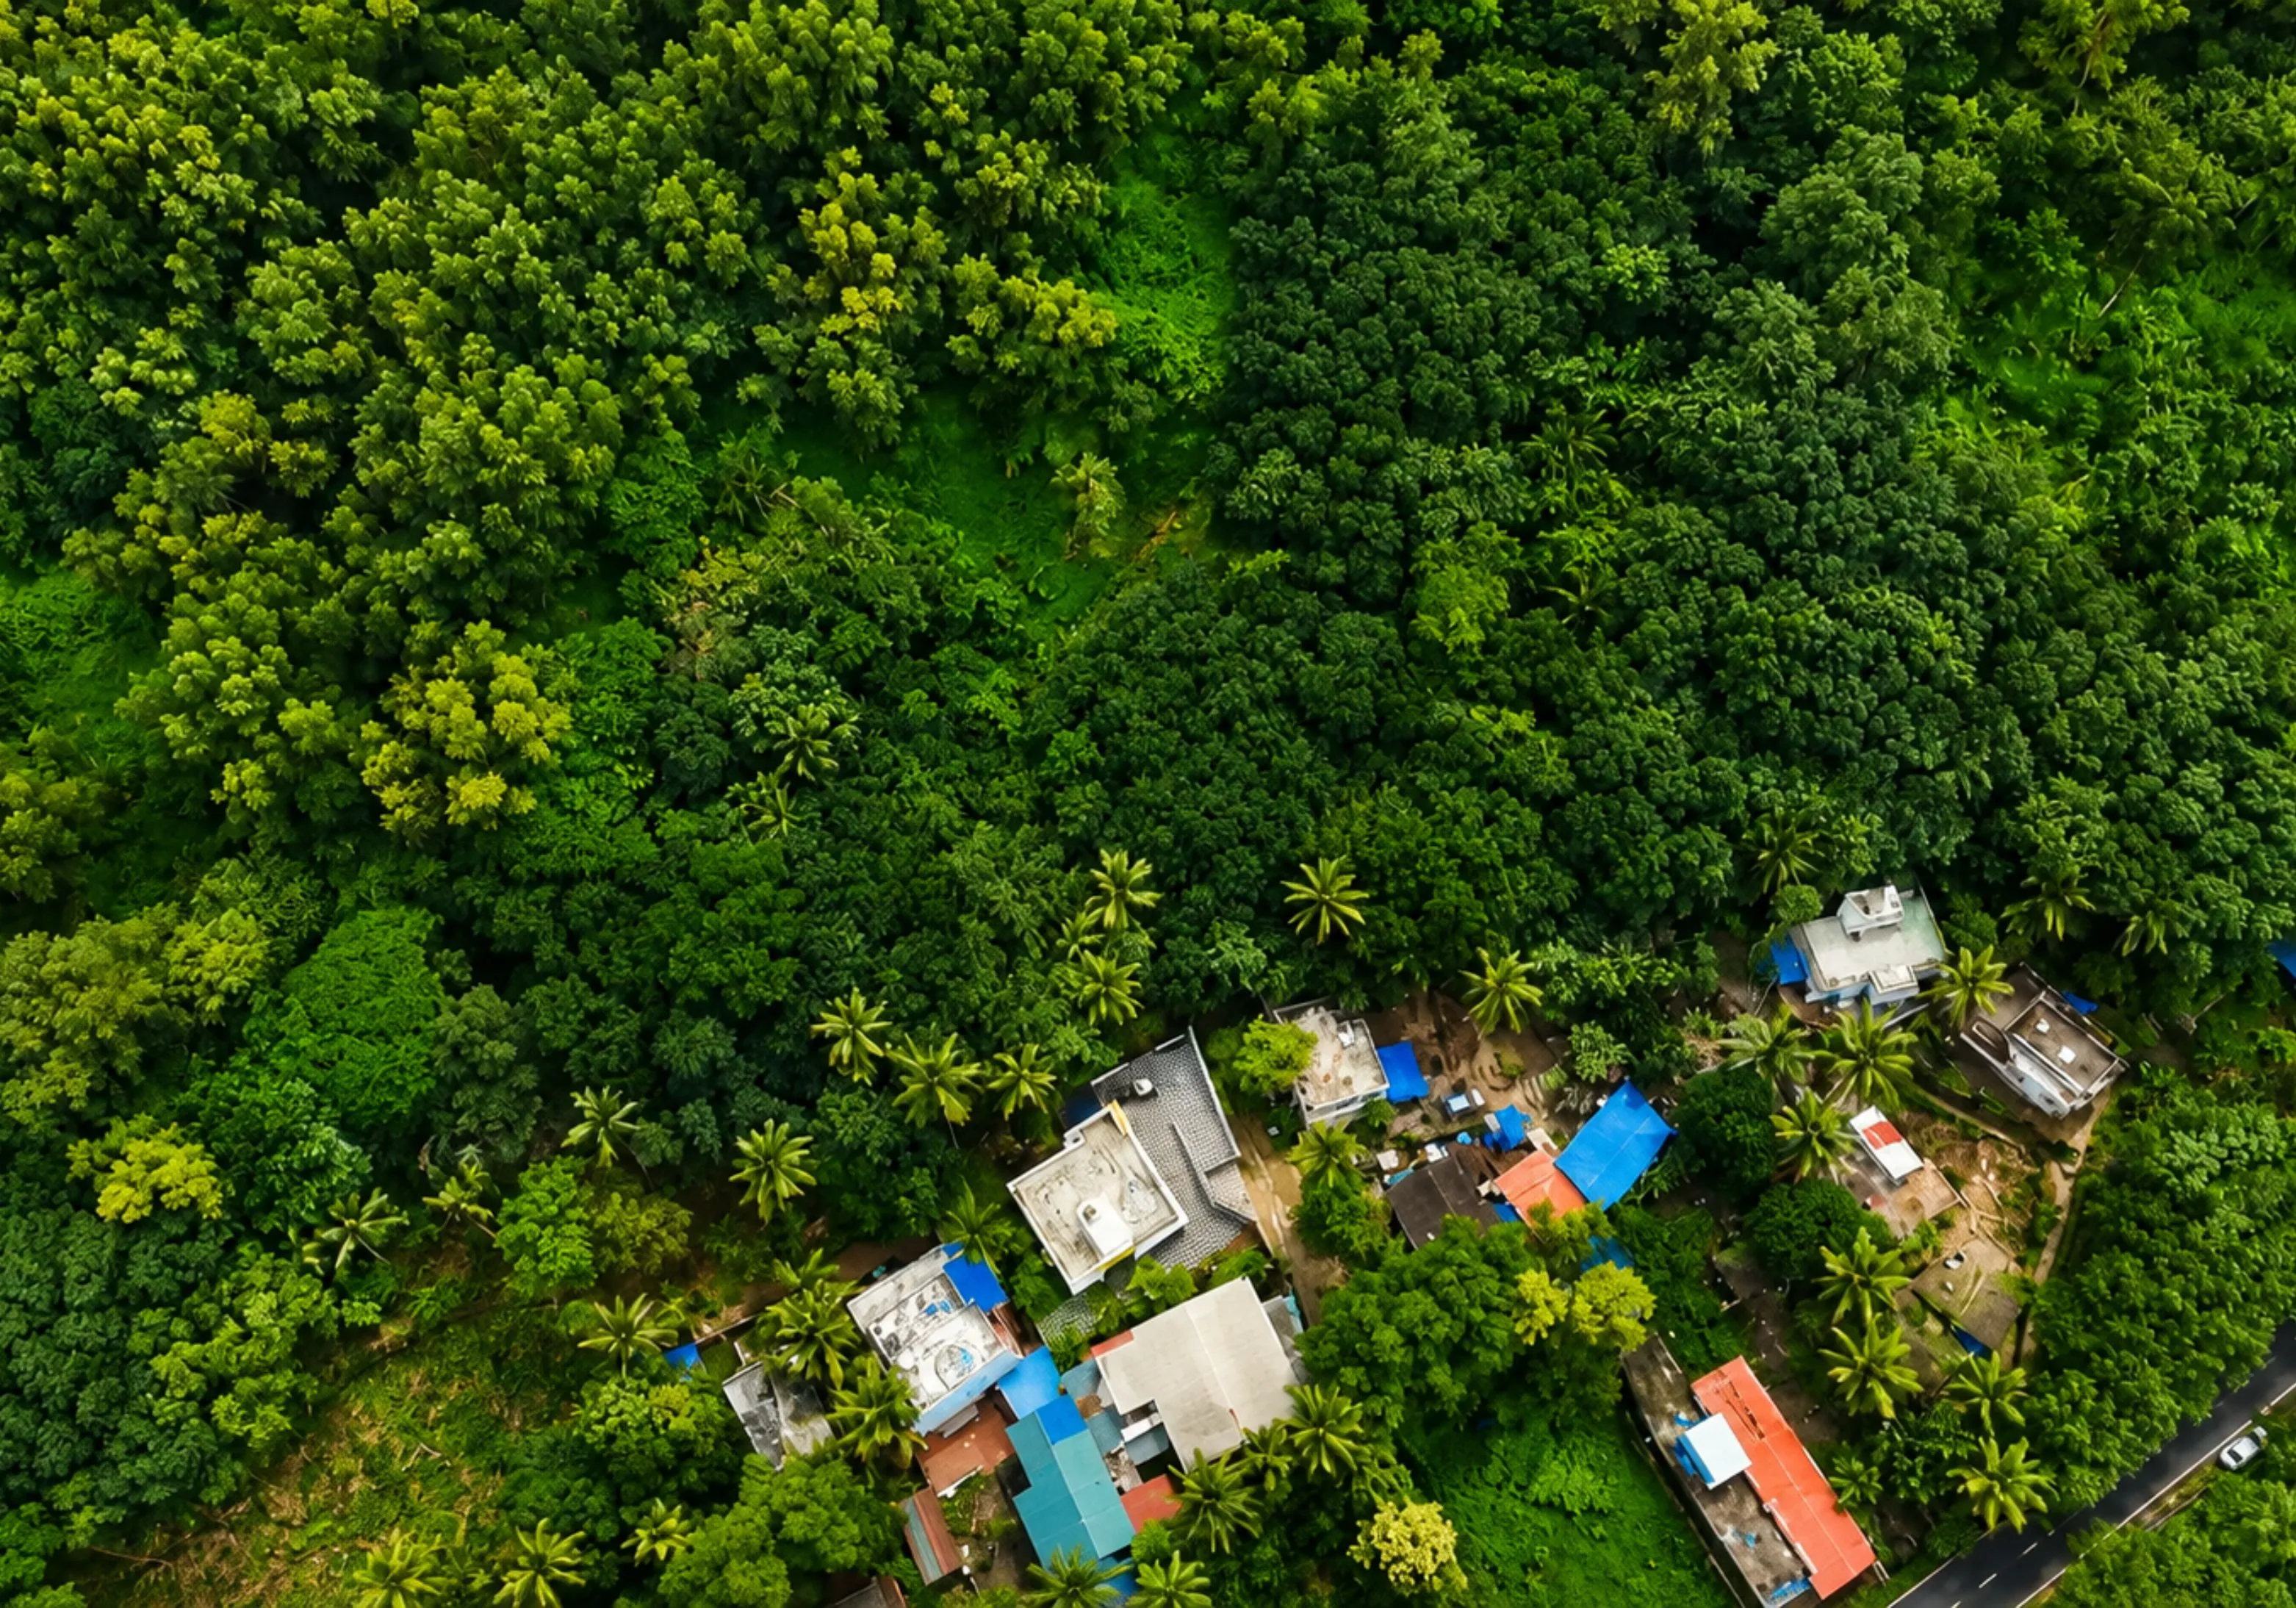 LIDAR TERRAIN DATA
Dense laser returns are classified and filtered into a bare-earth model at 0.1m contour intervals.
Every project moves through the same accountable workflow — planned, executed and quality-checked within one in-house team.
Define objectives, site conditions, accuracy needs and required outputs.
Flight planning, sensor selection, safety assessment and airspace verification.
Acquire RGB, thermal, LiDAR or other required data using the planned mission.
Convert raw data into orthomosaics, models, measurements and inspection datasets.
Check coverage, accuracy, positioning and data completeness against requirements.
Provide structured reports, maps and geospatial outputs your team can use.
We explain methodology rather than claim "high accuracy." Every figure below is validated against independent, surveyed checkpoints held out of the processing loop.
Real-time and post-processed kinematic positioning resolved against geodetic networks for centimeter-level flight telemetry.
Physical Ground Control Points and independent blind checkpoints tie every model to local datums and prove accuracy is not self-reported.
Dense LiDAR and photogrammetric returns, classified into ground, vegetation, structure and noise before delivery.
Custom elevation contour lines at 0.1m, 0.5m and 1.0m intervals, matched to project tolerance.
Outputs reprojected into the client-specified EPSG code, ready for direct import into QGIS, ArcGIS or AutoCAD Map 3D.
A sample of documented Lesoko field projects.
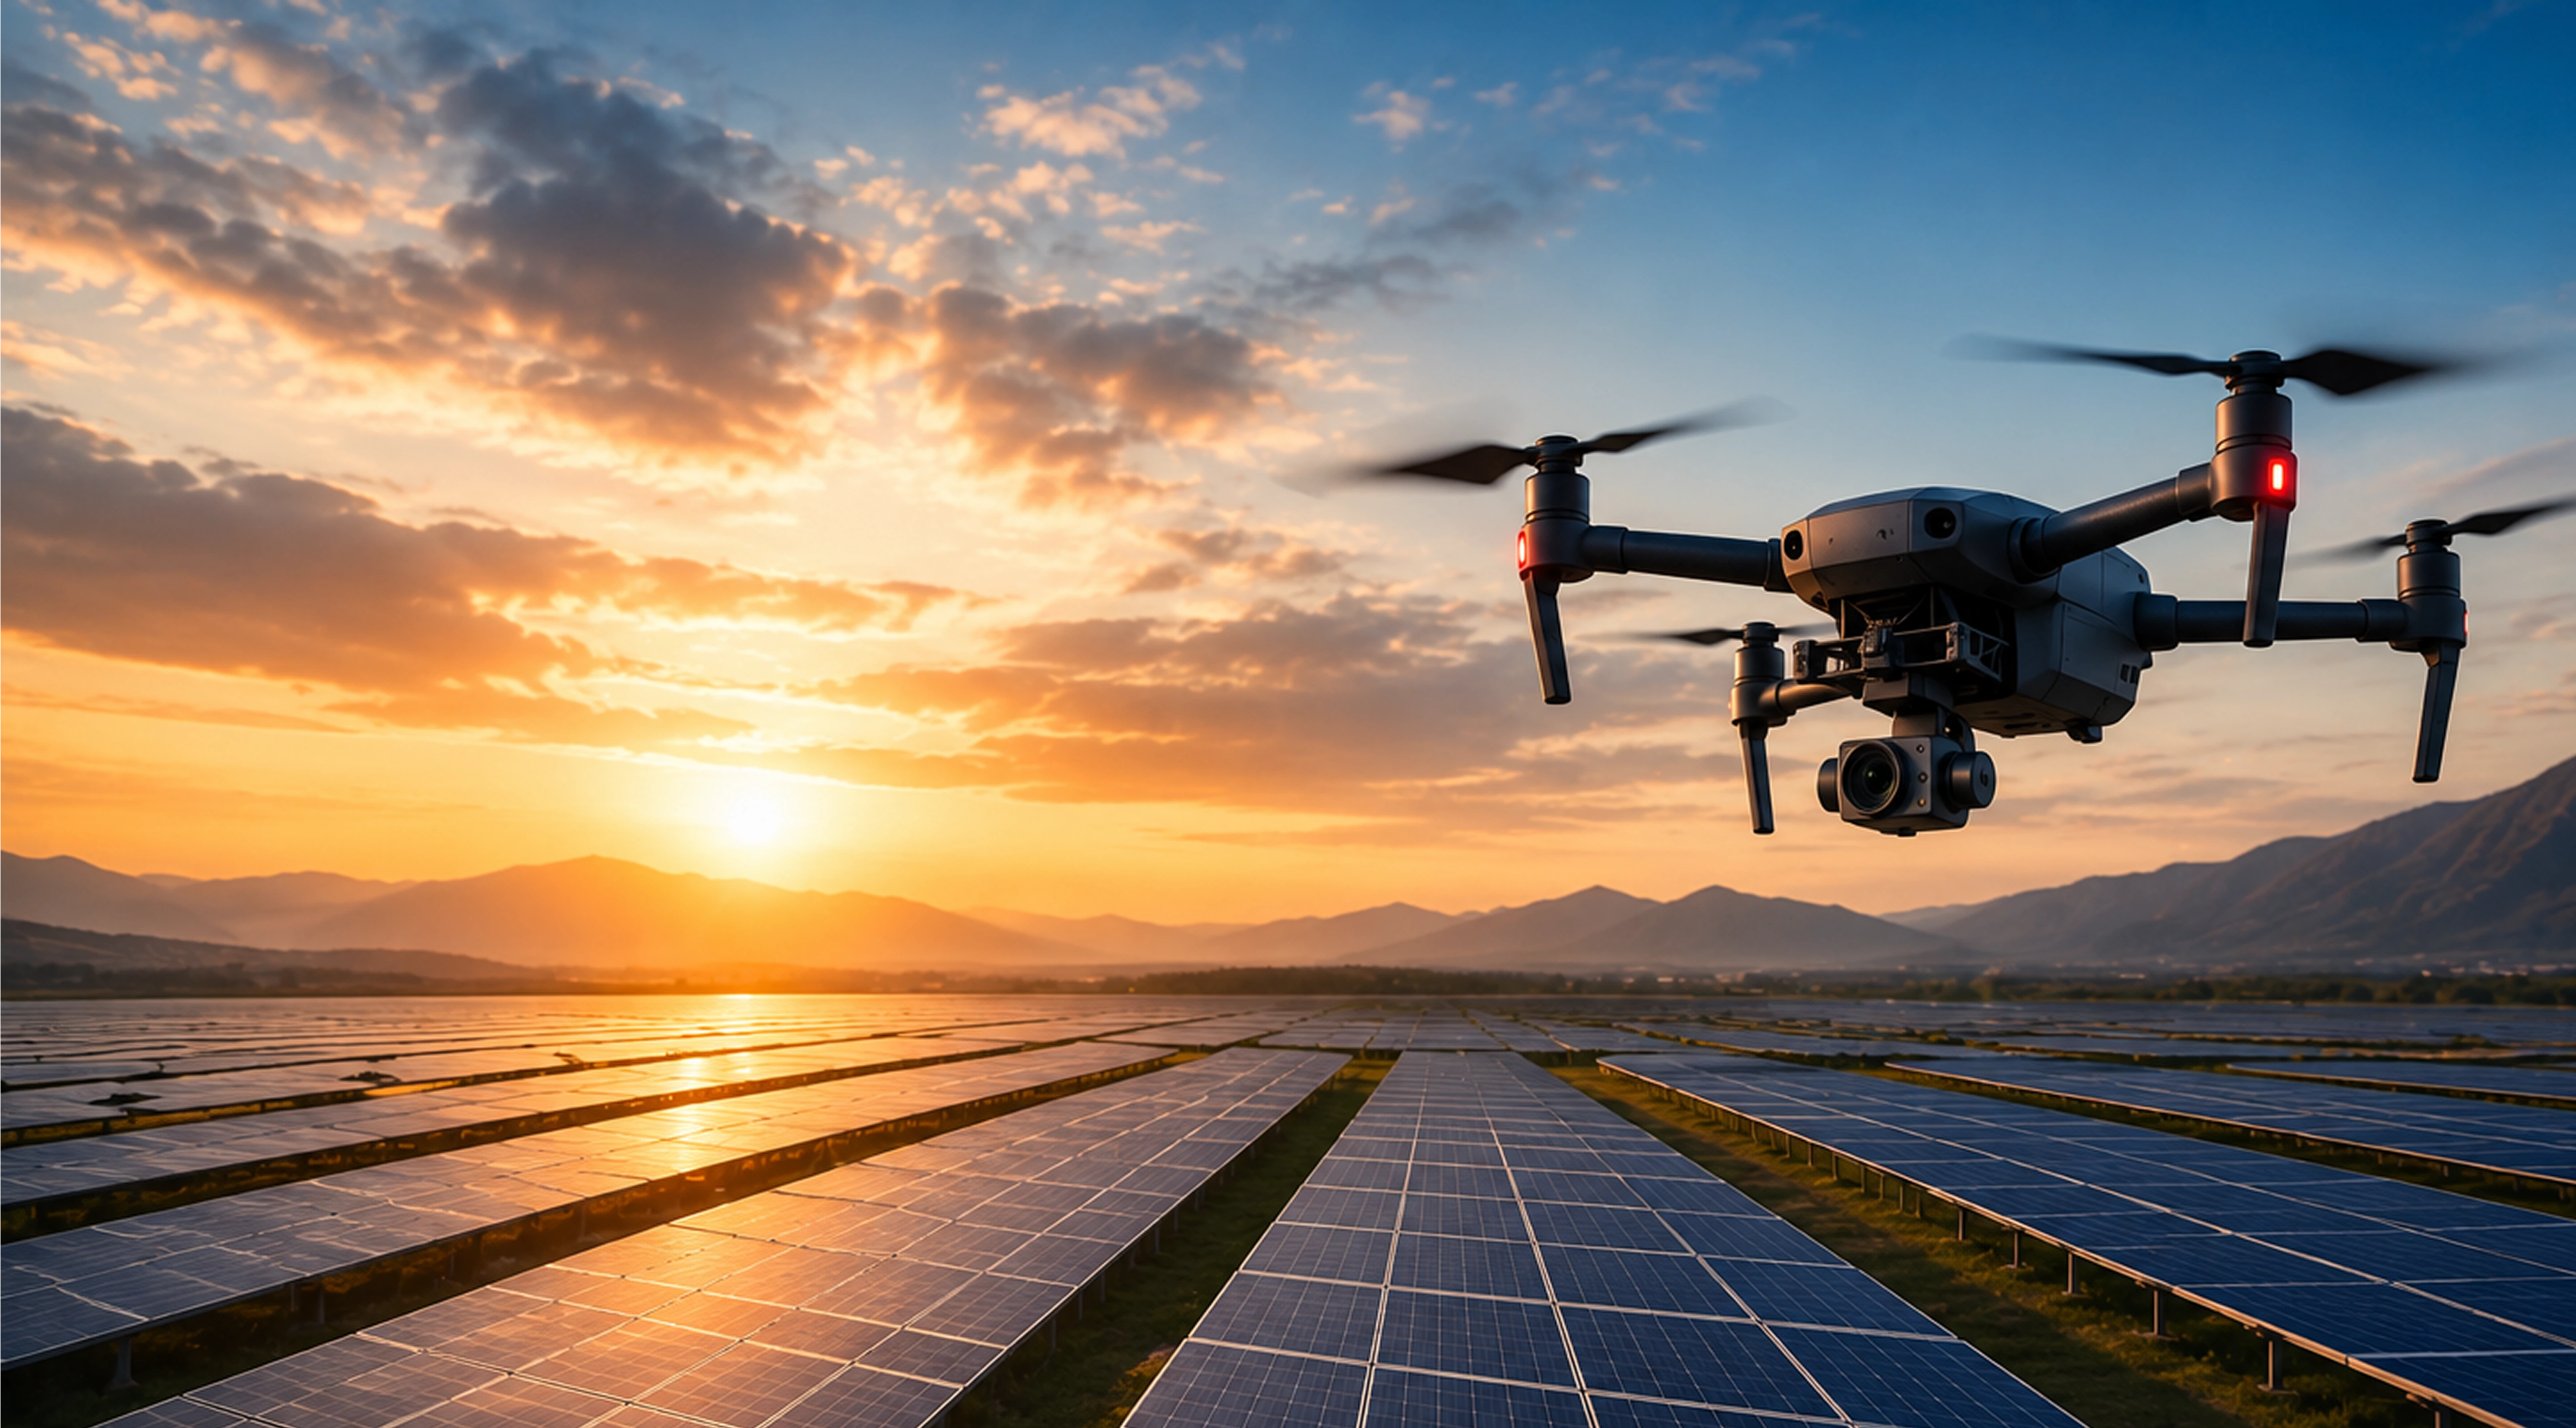
Build a complete module-level thermal record of an 810 MW site, with every anomaly typed and counted.
Geo-tagged thermal and RGB capture, with defects typed and graded against IEC 62446-3:2017.
13,848 anomalies recorded across the plant, with the report submitted 21 days after inspection.
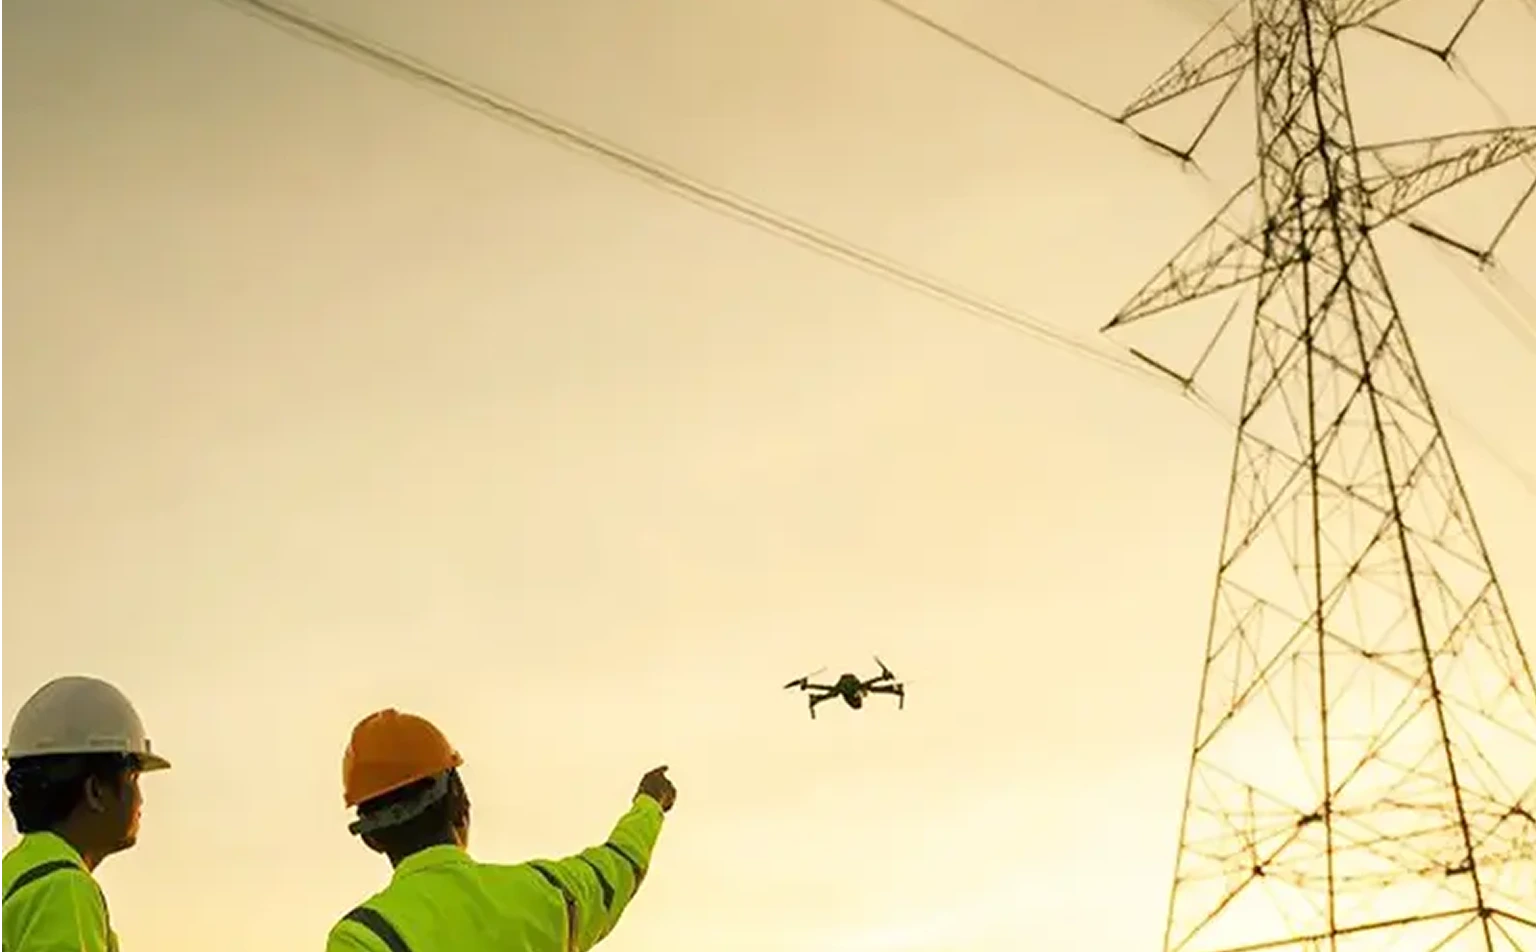
Create a component-level condition record for a 33 kV line, with each finding tied to a tower, sub-component and GPS position.
Drone inspection of the towers, logging each finding by component, defect type, criticality, coordinates and thermal readings.
A filterable workbook of 522 component records across 224 towers, with 144 rated high criticality.

Get reliable levels across mixed terrain, including a river corridor, before layout and grading design could start.
GNSS control with 30 survey control points, plus drone capture at 60 m with 80% frontal and 70% side overlap (25,575 images processed).
Orthophoto, terrain model, 1 m contours and 10 × 10 m spot levels.
We show you the deliverable — because that's what your engineers, GIS leads, and O&M teams need to increase productivity.
Thermal and visual inspection of solar plants, turbines, towers and industrial assets resolved to component-level defects.
Raw geospatial data, translated into executive summaries, KPIs, defect registers and maps
 defect severity dashboard stockpile volume report defects per-blade report component criticality recommendation thermal findings report 3D model progress comparison asset mapping GIS layers corridor mapping GIS O&M inspection report structural monitoring report 3D model planning data cross-sections CAD vegetation maps analysis change detection GIS

"Lesoko has been our trusted drone services partner for engineering surveys and thermal inspections across our solar plants. Their AutoCAD 2D/3D deliverables are accurate and well-structured, and their reports have been invaluable for our design and O&M planning."
"We've worked with Lesoko across rooftop surveys, topography mapping, and solar thermal inspections. Their team consistently delivers accurate data and detailed reports, with the clarity and technical expertise to ensure smooth execution on every project."
"Lesoko's drone inspections consistently catch module hotspots and string failures before they escalate. Their reports are clear and well-structured, and their 24/7 support has made them a trusted partner for our solar assets year after year."
"Working with Lesoko has been a privilege from day one. Their team is highly professional, responsive, and technically sound, with clear communication and quick turnarounds that consistently helped us meet client expectations."
"Lesoko has been our trusted drone services partner for engineering surveys and thermal inspections across our solar plants. Their AutoCAD 2D/3D deliverables are accurate and well-structured, and their reports have been invaluable for our design and O&M planning."
"We've worked with Lesoko across rooftop surveys, topography mapping, and solar thermal inspections. Their team consistently delivers accurate data and detailed reports, with the clarity and technical expertise to ensure smooth execution on every project."
"Lesoko's drone inspections consistently catch module hotspots and string failures before they escalate. Their reports are clear and well-structured, and their 24/7 support has made them a trusted partner for our solar assets year after year."
"Working with Lesoko has been a privilege from day one. Their team is highly professional, responsive, and technically sound, with clear communication and quick turnarounds that consistently helped us meet client expectations."
Everything you need to know about our drone inspection and aerial intelligence services.
Contact SupportThere is no single price, because cost depends on the project. The main factors are the area or length to be covered, terrain and site access, the sensor used (RGB, thermal or LiDAR), RTK/PPK and ground-control requirements, the deliverables you need, travel to site, and processing effort. Inspection projects also vary by asset type and count. Share your site, scope and required outputs and our engineers will send a scoped quote.
Accuracy depends on the project specification, not on the drone alone. The main factors are the sensor, flight height and overlap, RTK/PPK positioning, ground control points and independent checkpoints, terrain and weather, and the processing method. We plan each mission to the accuracy you need, then validate coverage, positioning and data completeness before anything is delivered.
Yes, civil drone operations are permitted under India's Drone Rules, 2021. What applies to a given job depends on the drone category, the operation and the airspace. India's Digital Sky map divides airspace into green, yellow and red zones. Green zones do not need prior permission up to the permitted height, while yellow and red zones need permission first. Commercial operations also need registered drones and certified remote pilots. Lesoko flies with DGCA in-house pilots, checks airspace before every mission and follows pre-flight safety procedures.
Photogrammetry builds maps and 3D models from overlapping images. It suits open terrain and works well for orthomosaics, visual records and progress comparison. LiDAR measures with laser pulses, so it can capture bare-earth terrain beneath dense vegetation and suits corridors and complex terrain. Neither is always better, and some projects use both. We recommend the method that fits your terrain, accuracy requirement and deliverables.
You receive processed, usable outputs rather than raw images. For surveys these include orthomosaics, DSM/DTM/DEM, contours, point clouds, 3D models, and CAD and GIS files. For inspections they include thermal and RGB imagery, a geo-tagged defect register with severity classification, and an inspection report. For progress monitoring you receive orthomosaic comparisons and periodic reports. Where relevant, results come in a dashboard and in formats your team can import.
Tell us what you need to survey, inspect, monitor or
measure -- an engineer will follow up with next steps.