Open circuit
515
Module hotspot
150
Multiple hotspot
43
Dust, shadow & other (6 categories)
107
815 recorded defects/anomalies
Criticality: High 92% · Medium 8%
Drone Inspection & Asset Intelligence
Lesoko plans, captures, processes and reports UAV-based inspections across large industrial sites — RGB and thermal data, geo-tagged findings, criticality classification and structured reporting.
5 Lakh+
Safe Drone Flights
8,300+
Transmission Towers Inspected
21,354+
Power-Line Components Inspected
99%
Defect Detection Accuracy
What you receive
Geo-tagged visual and thermal imagery captured together, so a thermal anomaly can always be checked against its visual context.
What condition was observed, and where
Every finding is logged by defect type and criticality (High / Medium / Low), not left as an unsorted image folder.
What needs attention first
Findings are mapped to your existing asset layout — block → inverter → SCB → row → table → panel for solar, or tower and component for transmission lines.
Locating the issue in the field
Module/component temperature, hotspot temperature, minimum temperature and delta-T against Lesoko's documented severity thresholds.
Prioritizing genuine anomalies over noise
Project details, methodology, equipment used, defect summary, defect list and individual defect evidence pages.
Engineering and management review
Structured Excel export by component, defect and criticality, alongside a dashboard for tracking status, assignment and resolution.
Tracking findings through to close-out
Report structure

Defect 0142
Solar Thermography — RGB + Thermal
Module Hotspot
Module temp 41.2°C
Hotspot Temperature
68.7°C
Delta T
27.5°C
Coordinates
GPS logged
01
Every finding numbered and indexed against the asset's own layout or nomenclature — block, inverter, row and panel for solar; tower and component for transmission lines.
02
Location, module/tower coordinates, thermal image, temperature readings and criticality for each finding.
03
Total anomalies by type and by criticality, so the client sees the scale of the finding set before the detail.
04
Site, plant capacity, inspection date, irradiance and environmental conditions at time of capture, referenced against the asset's own layout.
05
The methodology followed for this project, the drone and camera specification used, and any areas not inspected or conditions affecting data quality, stated explicitly.
Project evidence
These are recorded findings from completed Lesoko inspection projects — the actual scale and defect data, not illustrative examples.
Open circuit
515
Module hotspot
150
Multiple hotspot
43
Dust, shadow & other (6 categories)
107
815 recorded defects/anomalies
Criticality: High 92% · Medium 8%

Sub-string short circuit
5,496
Vegetation
4,299
Dust
2,037
Multiple hotspot & other (6 categories)
2,016
13,848 recorded defects/anomalies
Criticality: Medium 48% · High 46% · Low 6%
Corrosion
336
Hotspot
143
Vegetation, damage& foreign object
43
Components tracked: tower body, insulator, anti-climb fence, joints,pole leg, jumper
520 records, 224 towers flagged
How it's done
01
Drone flies the planned mission — RGB, thermal or LiDAR as scoped — with every capture point position-logged via RTK/PPK.
02
Raw data is georeferenced, stitched into an orthomosaic, and thermal readings calibrated against logged site conditions.
03
Analysts, with AI-assisted flagging, review the dataset against an asset-specific defect taxonomy and grade severity.
04
A senior reviewer cross-checks every finding against raw data; critical defects get a second analyst's review.
05
Findings are compiled into your report package, delivered within target turnaround, with support for follow-up questions.
Inspection services by asset type

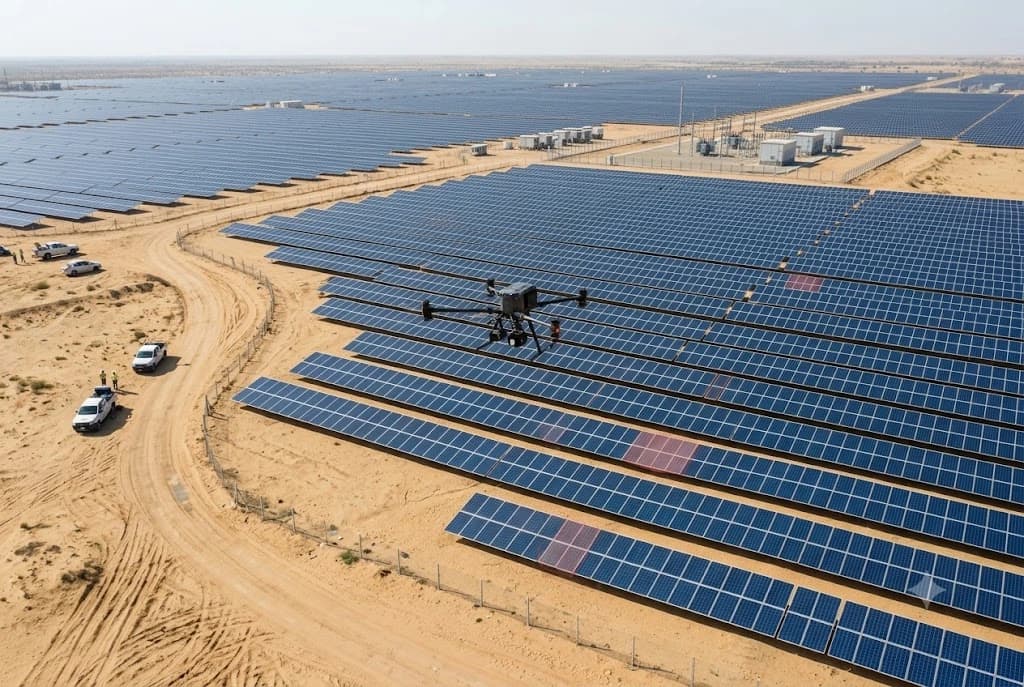
Radiometric thermal mapping and high-resolution visual data to protect grid uptime and renewable asset yield

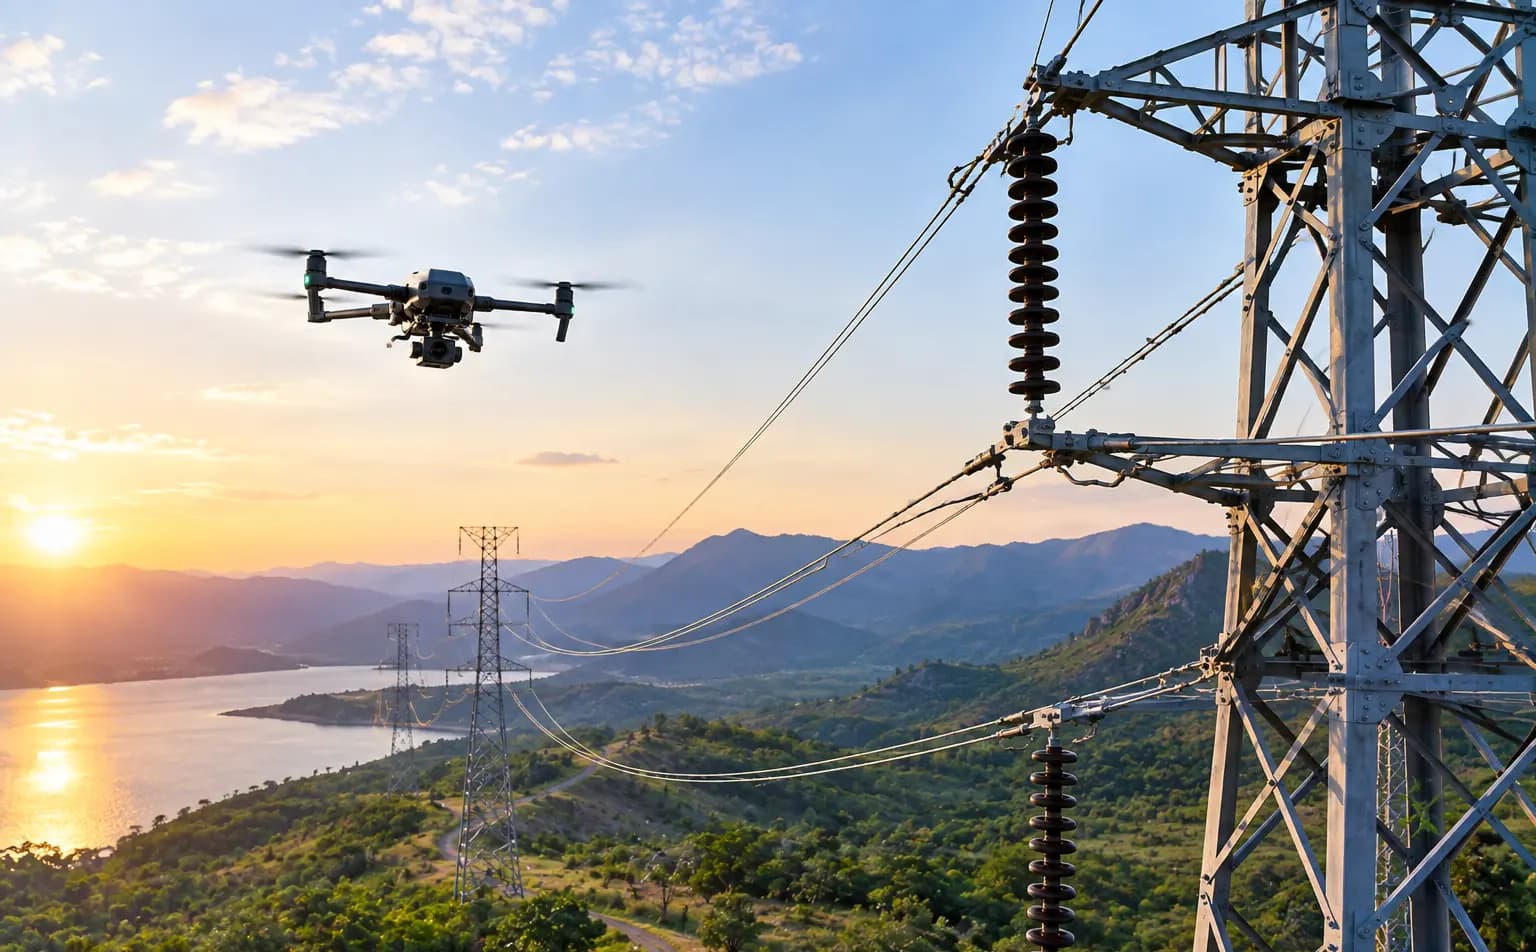
Critical asset integrity checks in complex, hazardous environments without putting personnel in harm's way.
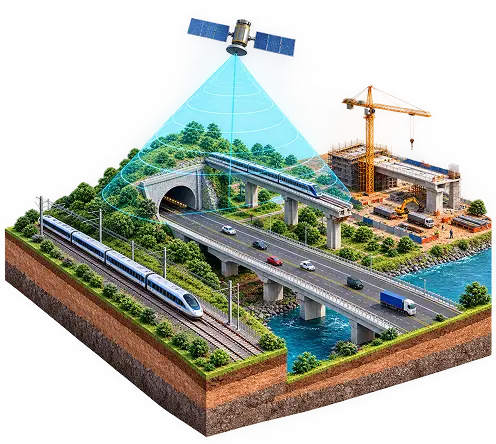
Rapid assessment of vast corridors and structural lifespans using automated flight paths and photogrammetry.
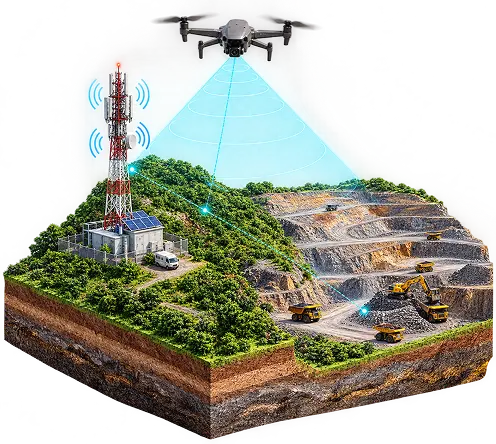
Detailed 3D modelling and volumetric calculations for asset maintenance and site surveys.
Technical confidence
Thermal sensor specifications
Documented
Sensor type
Uncooled VOx microbolometer
Resolution
640 × 512 @ 30 Hz
Stated temperature accuracy
±2°C or ±2%
Scene range
−40°C to 550°C
Digital zoom
16×
Visual (RGB) sensor specifications
Documented
Sensor
1/2″ CMOS, 48 MP
Field of view
84°, f/2.8
Max image size
8000 × 6000
Video
3840×2160 @ 30 FPS
Digital zoom
32×
Specifications above are the sensor package documented on Lesoko's solar thermography projects. A camera's stated temperature accuracy is a sensor specification, not a guarantee for every inspection condition — actual thermal accuracy depends on emissivity, distance, angle and environmental conditions at capture. Sensor configuration is confirmed against the inspection objective for each project.
Why Lesoko
Most drone companies describe what drones can do. We can show what our inspections have actually produced — 815 to 13,848 classified findings per project.
Coverage and image quality are checked on site before the team leaves, and data is uploaded the same day.
Findings are logged against your asset's own layout — block, inverter, row, table, panel, or tower and component.
Where scoped, findings can be tracked from open to resolved through a project dashboard, rather than living only inside a static PDF
FAQ
Everything you need to know about working with Lesoko. Can't find what you're looking for?
Contact SupportLesoko plans, captures, processes and reports UAV-based inspections across large industrial sites — RGB and thermal data, geo-tagged findings, criticality classification and structured reporting.
Solar plants, transmission lines and other industrial assets. Findings are mapped to your own asset layout — block, inverter, SCB, row, table and panel for solar, or tower and component for transmission lines.
Lesoko reports 99% defect detection accuracy. A senior reviewer cross-checks every finding against the raw data, and critical defects get a second analyst's review.
It depends on the asset, its size and the scope. After you request an inspection, we return a proposal with scope, methodology, deliverables, timeline and commercial terms clearly laid out.
Our target is a severity-graded report within 24-48 hours. Flights are scheduled around your operating hours.
Every flight is DGCA-compliant, flown by DGCA-certified remote pilots under NPNT and DigitalSky protocols.
Project details, methodology, equipment used, a defect summary, the defect list and individual defect evidence pages — plus a structured Excel register and a dashboard for tracking findings through to close-out.
Drone inspection captures what can be seen and thermally measured from the air. Areas not inspected and any conditions that affect data quality are stated explicitly in the report.
Request inspection
We'll return a proposal with scope, methodology, deliverables, timeline and commercial terms clearly laid out.