Drone Construction Progress Monitoring

Drone Construction Progress Monitoring in India

Dated aerial evidence of what has actually been built, reported work front by work front. Owners, lenders and EPC teams verify progress on solar and wind sites, including their civil works, without relying only on site visits or self-reported percentages.

250 MW

REWA solar project, Madhya Pradesh, including night-shift progress

68 MW

Bhilai solar plant, weekly dated reporting across civil work fronts

13

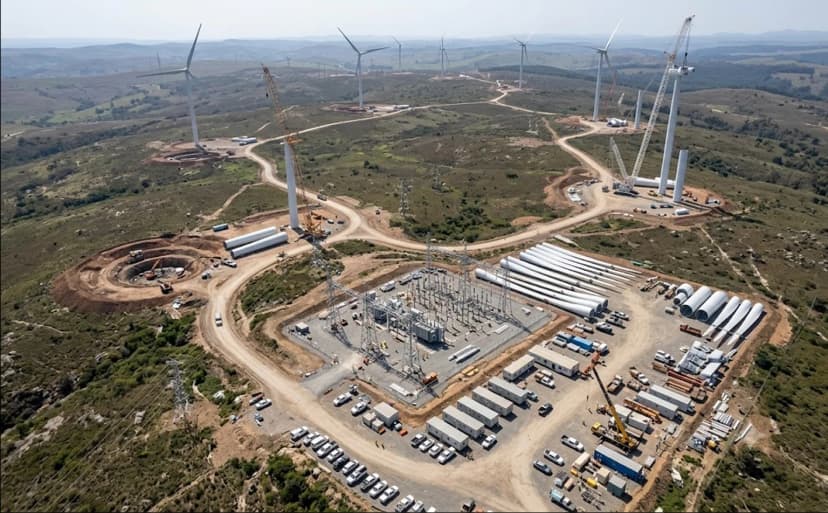
wind turbine locations tracked in a single installation report

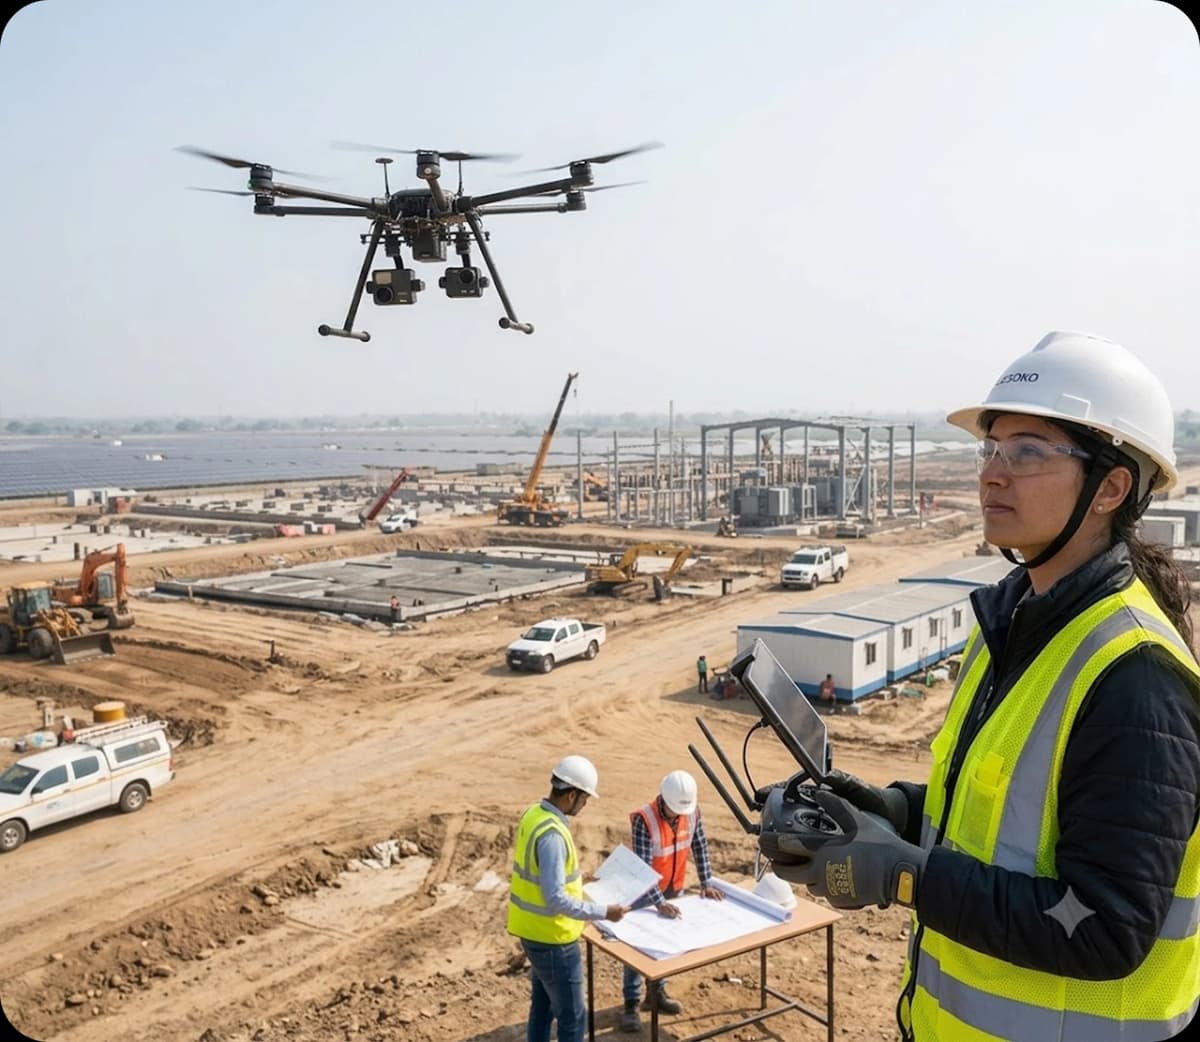
Drone flying over a construction site while a worker operates the drone and two workers review plans

In short

What can you verify from the air?

Drone construction progress monitoring is recurring aerial capture of a site, compared across dates and against the plan, to confirm what has been built. Lesoko reports what is visible and measurable from above: activity stage, who and what is on site, volumes moved and installed geometry.

Compared with site reports: dated aerial capture is not self-reported, and every cycle uses the same work-front labels, so progress stays comparable. Hidden or below-grade work cannot be seen from the air and still needs field records.

Owners, IPPs and lenders

Check claimed progress against dated imagery before a milestone is approved.

EPC and contractors

Keep a time-stamped record of every work front and plan next-day crews from current site data.

PMCs and owner's engineers

Hold an independent visual record across projects to support site reviews and certification.

Scope

What can be monitored on solar, wind and civil works?

  • 01Overall work progress, with time-lapsed across the project
  • 02Cut-and-fill volumes for each pit
  • 03Night-shift progress and activity
  • 04Table height difference and ground clearance
  • 05Idle workers on the field
  • 06Table-to-table distance and offset or shift
  • 07Panel cleaning progress and missed portions
  • 08Worker-safety observations

Other asset types are scoped per project, with the measurement method agreed up front.

Selected output

What does a monitoring report include?

  • Dated imagery by work front

    Captured on the same cadence so changes are comparable.

  • Progress and time-lapsed record

    The project’s story from first activity to latest capture.

  • Status register by location

    One line per turbine, block or building, with stage and status.

  • Cut-and-fill volumes

    For excavation pits and earthwork areas.

  • Installation geometry checks

    Solar table height, ground clearance, spacing and offset.

  • Workforce observations

    Idle workers and night-shift activity.

Format, cadence and tolerances are agreed in scope before capture.

SAMPLE OUTPUT: STATUS REGISTER

  • KR-07Casting, backfillingIn Progress
  • KR-08InstalledComplete
  • KR-25Steel bindingIn Progress
  • KR-28InstalledComplete
  • KR-29InstalledComplete
  • KR-33Blade lifting prepIn Progress
  • KR-37Crane assemblyIn Progress
  • KR-45Turbine lifting prepIn Progress
  • KR-52InstalledComplete
  • KR-58Blade assemblyIn Progress
  • KR-61Generator installIn Progress
  • KR-81Foundation castingIn Progress
  • KR-88Steel cuttingIn Progress
  • PSSConcrete fillingIn Progress
  • Site officeCompletedComplete
  • ShedRoof CompletedComplete
  • Line PCCPCC workIn Progress

Reporting

How is planned vs actual progress reported?

Each work front is reported against the agreed baseline: the schedule, drawings or milestone plan from the owner or EPC. The gap between what is built and what should be built is reported per work front, so delays are visible early.

Example report layoutIllustrative format, not project data

Example of the report layout only. Figures are placeholders; real reports use your baseline and dated captures.

Work frontPlannedObservedDeviationStatus
Foundation80%74%-6 ptsBehind
Structure65%68%+3 ptsOn track
Module Installation40%32%-8 ptsBehind
  1. 01

    Baseline first

    We confirm the schedule, drawings or milestone plan the percentages are measured against before the first capture.

  2. 02

    Observed, not reported

    Stage and quantity come from dated imagery and measurements, not contractor-stated percentages.

  3. 03

    Deviation by work front

    Ahead, on track or behind, with the capture date that supports it.

  4. 04

    Repeatable

    The same work-front labels each cycle, so trends and slippage can be tracked across reports.

The wind register above shows 4 of 13 turbines installed; comparing that with a programme needs the turbine schedule, agreed in scope.

Project evidence

Documented inspection projects

These are recorded findings from completed Lesoko inspection projects — the actual scale and defect data, not illustrative examples.

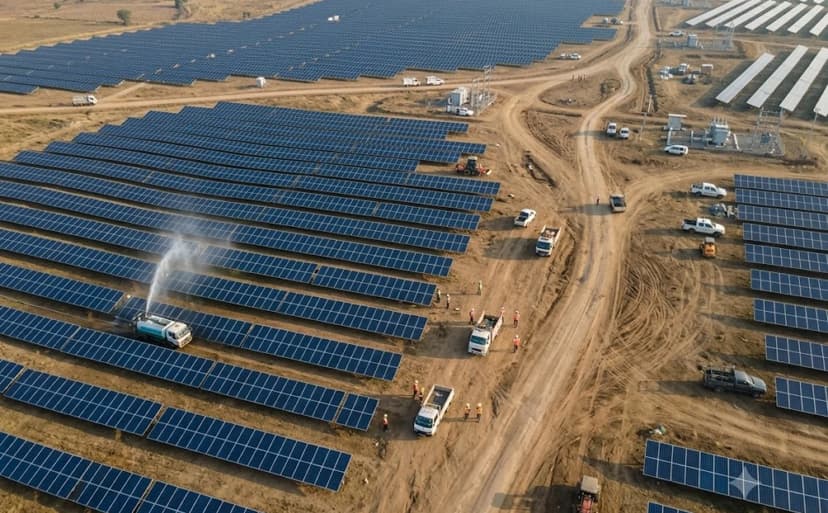
Aerial view of a large solar farm under construction, with solar panels, work vehicles and dirt roads

Solar Project · Madhya Pradesh

250 MW

Challenge

Keeping visibility over a large solar build across day and night shifts.

Captured

Work progress, night-shift progress, idle workers, panel cleaning, missed portions, table height, clearance and offset.

Outcome

Stakeholders had a consistent visual record to plan the next day's work.
View Case Study →
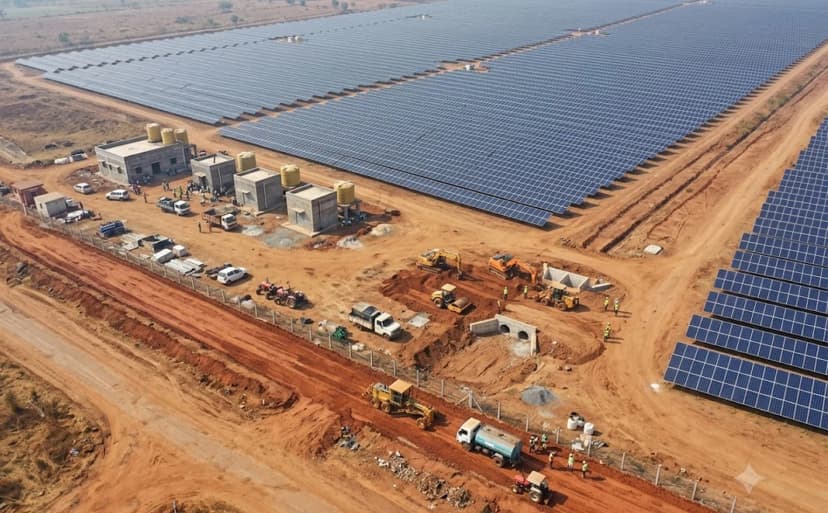
Aerial view of a solar plant under construction, with solar panels, earthmoving equipment and unfinished roads

Solar Plant · Raipur region · Weekly report, 11-17 Jan 2021

68 MW

Challenge

Several civil and infrastructure activities moving at once.

Captured

SCADA room, three inverter rooms with water tanks, culvert levelling, periphery road cleaning and levelling.

Outcome

Dated evidence for each work front, comparable across the week.

View Case Study →
Aerial view of a wind farm under construction, with wind turbines, cranes and a substation

Wind Farm Installation · Turbine locations in one report

13

Challenge

Turbines, substation and yards at different stages simultaneously.

Captured

Foundations through crane assembly, lifting and installation, plus substation, storage yard, office and shed.

Outcome

A single register showed 4 turbines installed and 9 in progress.

View Case Study →

How it works

How does a monitoring engagement run?

  1. 01

    Tell us what to track

    Choose the areas of your site, your schedule, and what the reports should help you decide.

  2. 02

    We plan access and timing

    Airspace assessment, site permission and safety induction are coordinated with your team, including night flights if needed.

  3. 03

    We fly on a fixed schedule

    The same areas every time, so each date compares cleanly.

  4. 04

    We check it against your plan

    Every capture is compared with the last one and with your schedule.

  5. 05

    You get a simple status report

    Progress by area, plus anything missing or running behind, ready for reviews and approvals.

Accuracy & standards

How is the data checked, and where are the limits?

  1. 01

    Agreed baseline

    The schedule, drawings or milestone plan that progress is measured against is confirmed in scope before the first capture.

  2. 02

    Dated, labelled capture

    Every image is dated and filed under a fixed work-front label, so each cycle can be compared with the last.

  3. 03

    Comparison before reporting

    Each work front is checked against its previous capture and against the plan before a status is assigned.

  4. 04

    Stated method and tolerance

    Measurement method and on-track tolerance are written into scope, so any deviation can be traced to how it was measured.

FAQ

Questions?
We’ve Got Answers

Everything you need to know about working with Lesoko. Can’t find what you’re looking for?

Contact Support

Request Inspection

Get a scoped quote for your asset

We’ll return a proposal with scope, methodology, deliverables, timeline and commercial terms clearly laid out.

  • DGCA-compliant flight, scheduled around your operating hours
  • Severity-graded report within a 24-48hr target
  • Raw data included