Drone above a construction site with three workers wearing hard hats and high-visibility vests

Project record

Our Case Studies

Real plants, real defect counts, real survey outputs. See what Lesoko's drone inspection and survey teams delivered on solar, transmission and land survey projects across India.

Solar inspection
Bikaner, Rajasthan15 May 2026, report on 29 May

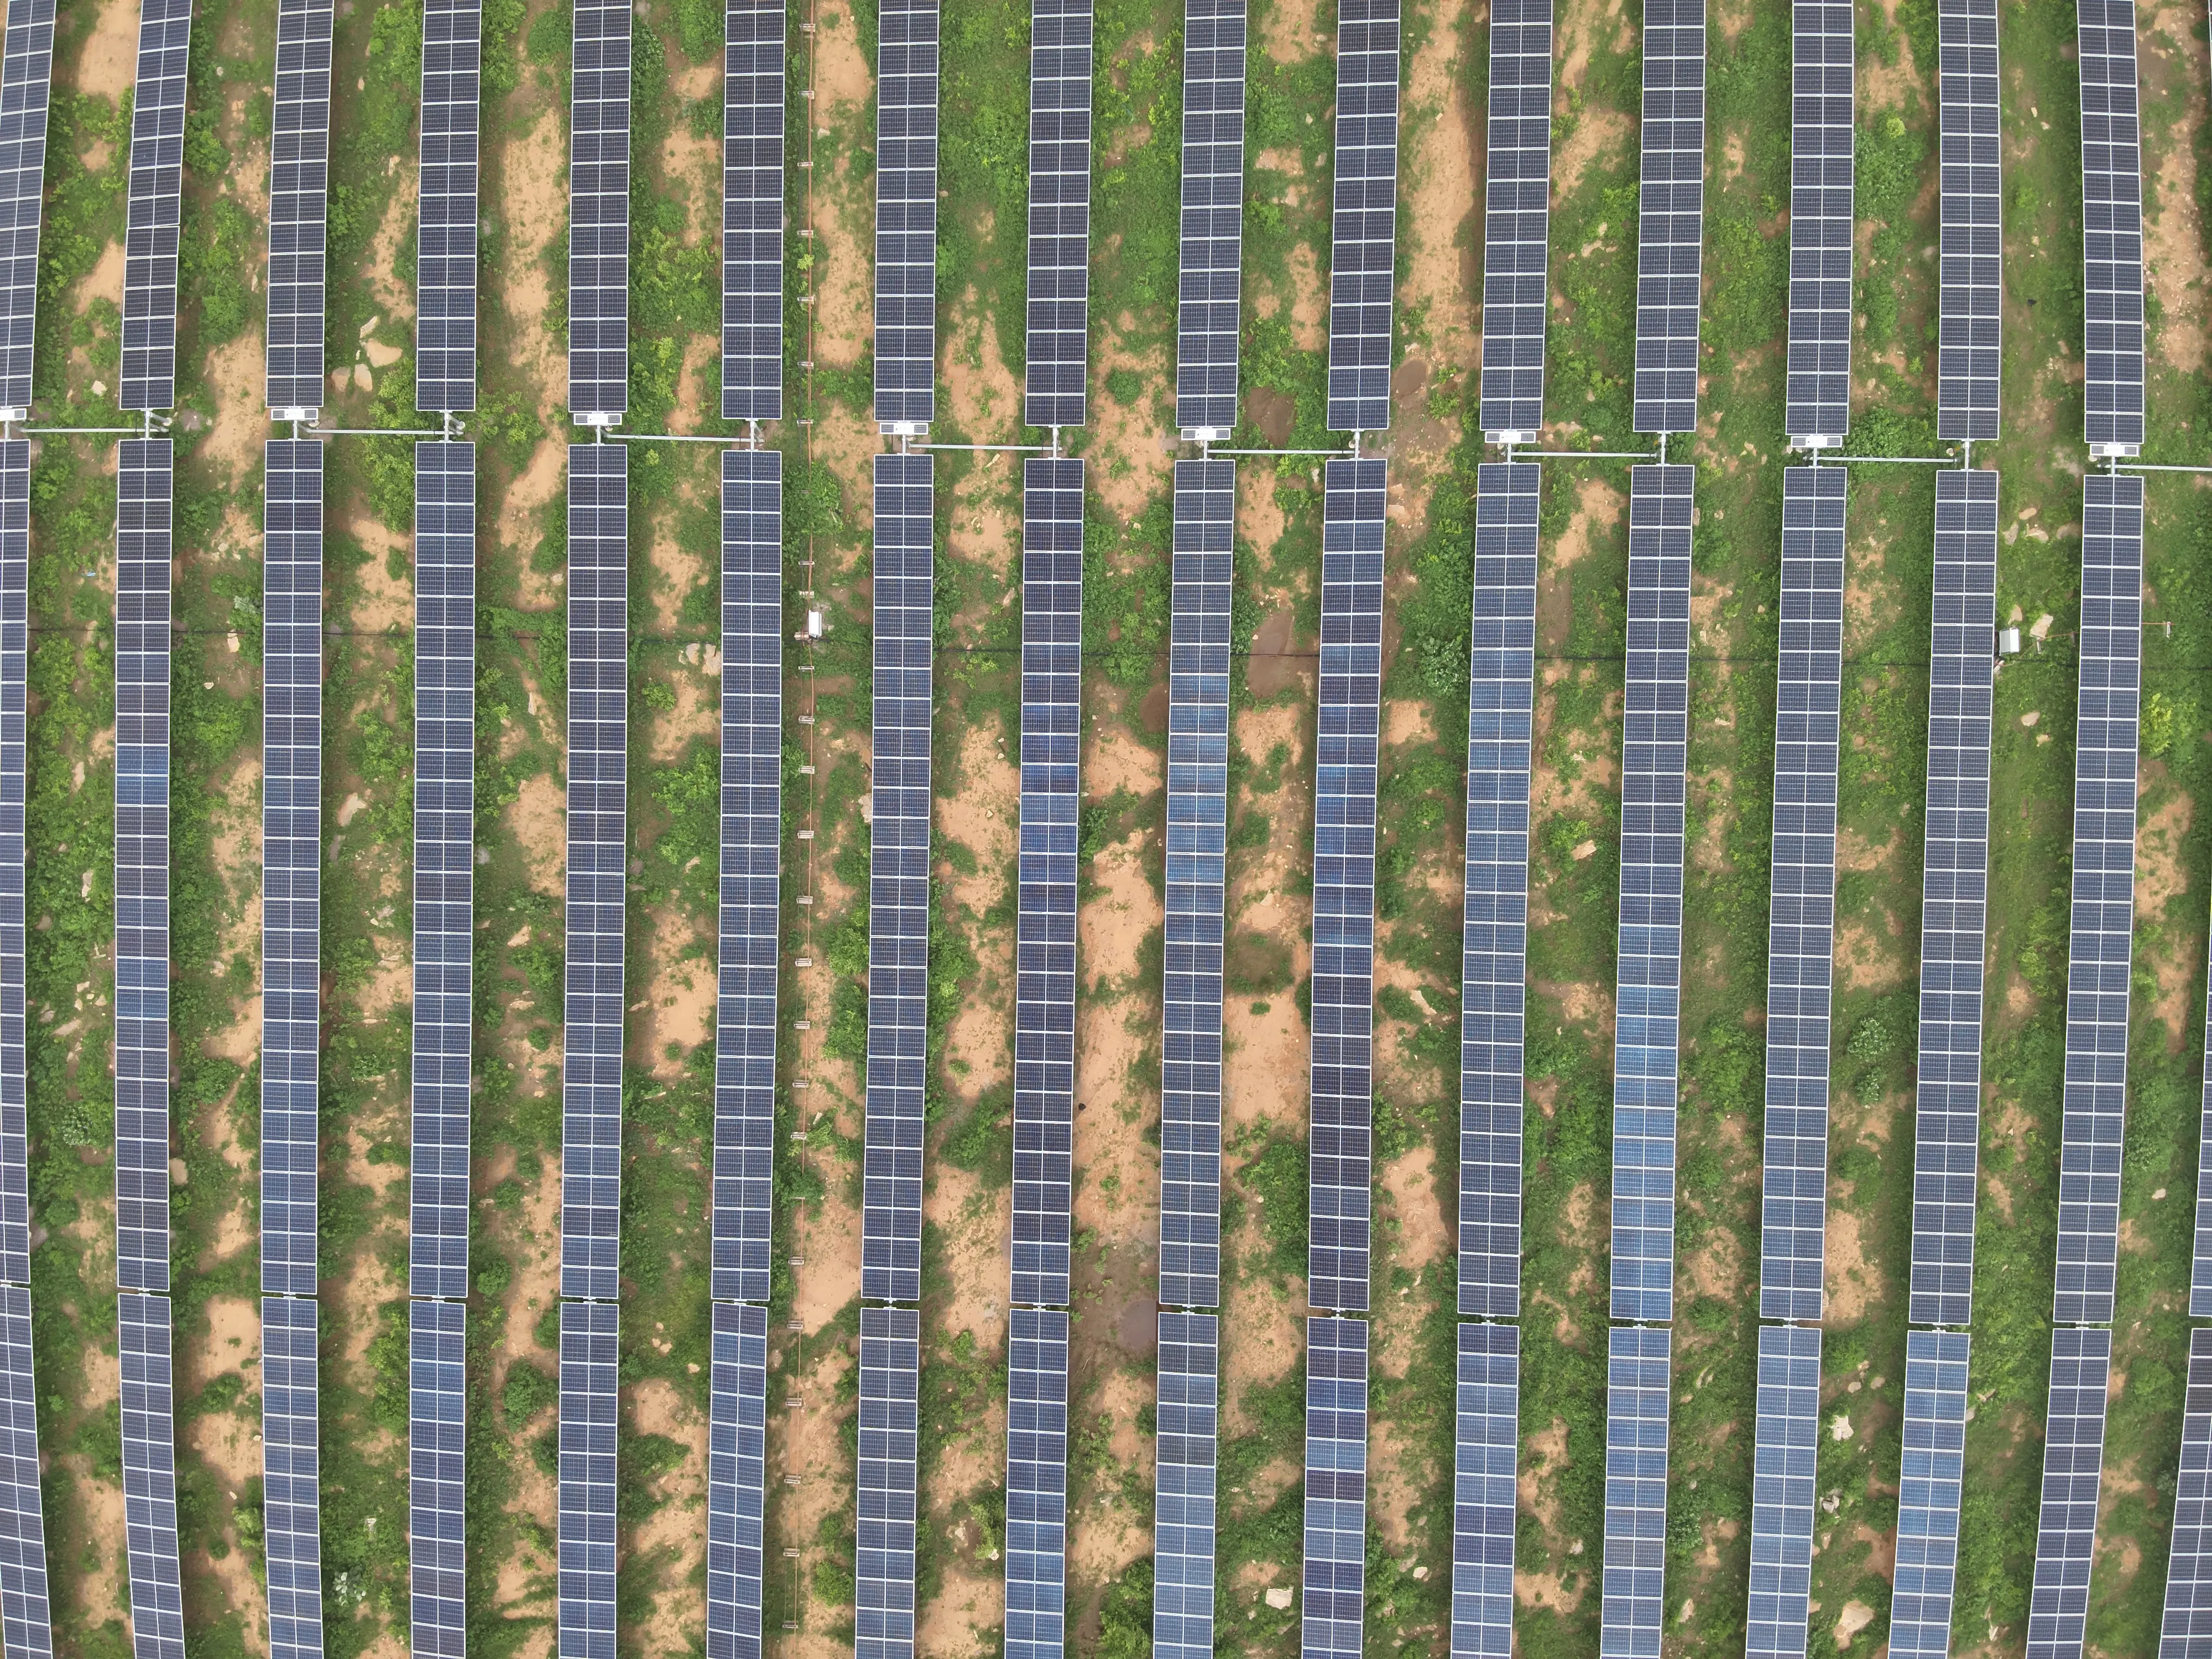
332 MW Solar Plant Thermal Inspection

The challenge

The scope was a thermal check of a 332 MW plant laid out in more than 20 blocks, with every fault tied to a specific position in the site's own array layout so a maintenance crew can find it.

Our solution

Lesoko flew a thermal and RGB drone survey at about 700 W/m² irradiance and geo-tagged every anomaly. Defects were typed against IEC 62446-3:2017 and graded by temperature difference: low under 5 °C, medium 5 to 10 °C, high above 10 °C. Each record carries block, inverter, SCB, row, column and table IDs plus GPS position, and a plant-wide defect map was delivered with the report.

815

anomalies detected and geo-tagged

332 MW

plant capacity thermally inspected

515

open circuit faults, the largest single class

14 days

from inspection to report submission

Impact

Open circuit faults made up 515 of the 815 records (about 63%), followed by 150 module hotspots, 43 multiple hotspots and 23 burnt junction boxes. Dust, shadow, vegetation, a single active bypass diode and 7 hotspots account for the rest. The site team received a layout-referenced list of every record, with IV curve testing suggested for root cause on the affected modules.

What we noticed: open circuit records usually span 4 to 7 panels within a single table, which points to a string or sub-string problem rather than isolated bad modules. They also cluster: SCB7 under inverter I1 in block B27, and SCB37 under inverter I3 in block B20, each carry dozens of records. Checking those combiner boxes and string connections first is a sensible start.

Limits: the counts describe one thermal survey window. Repair status and energy recovery are not part of this report.

Explore This Service
Solar inspection
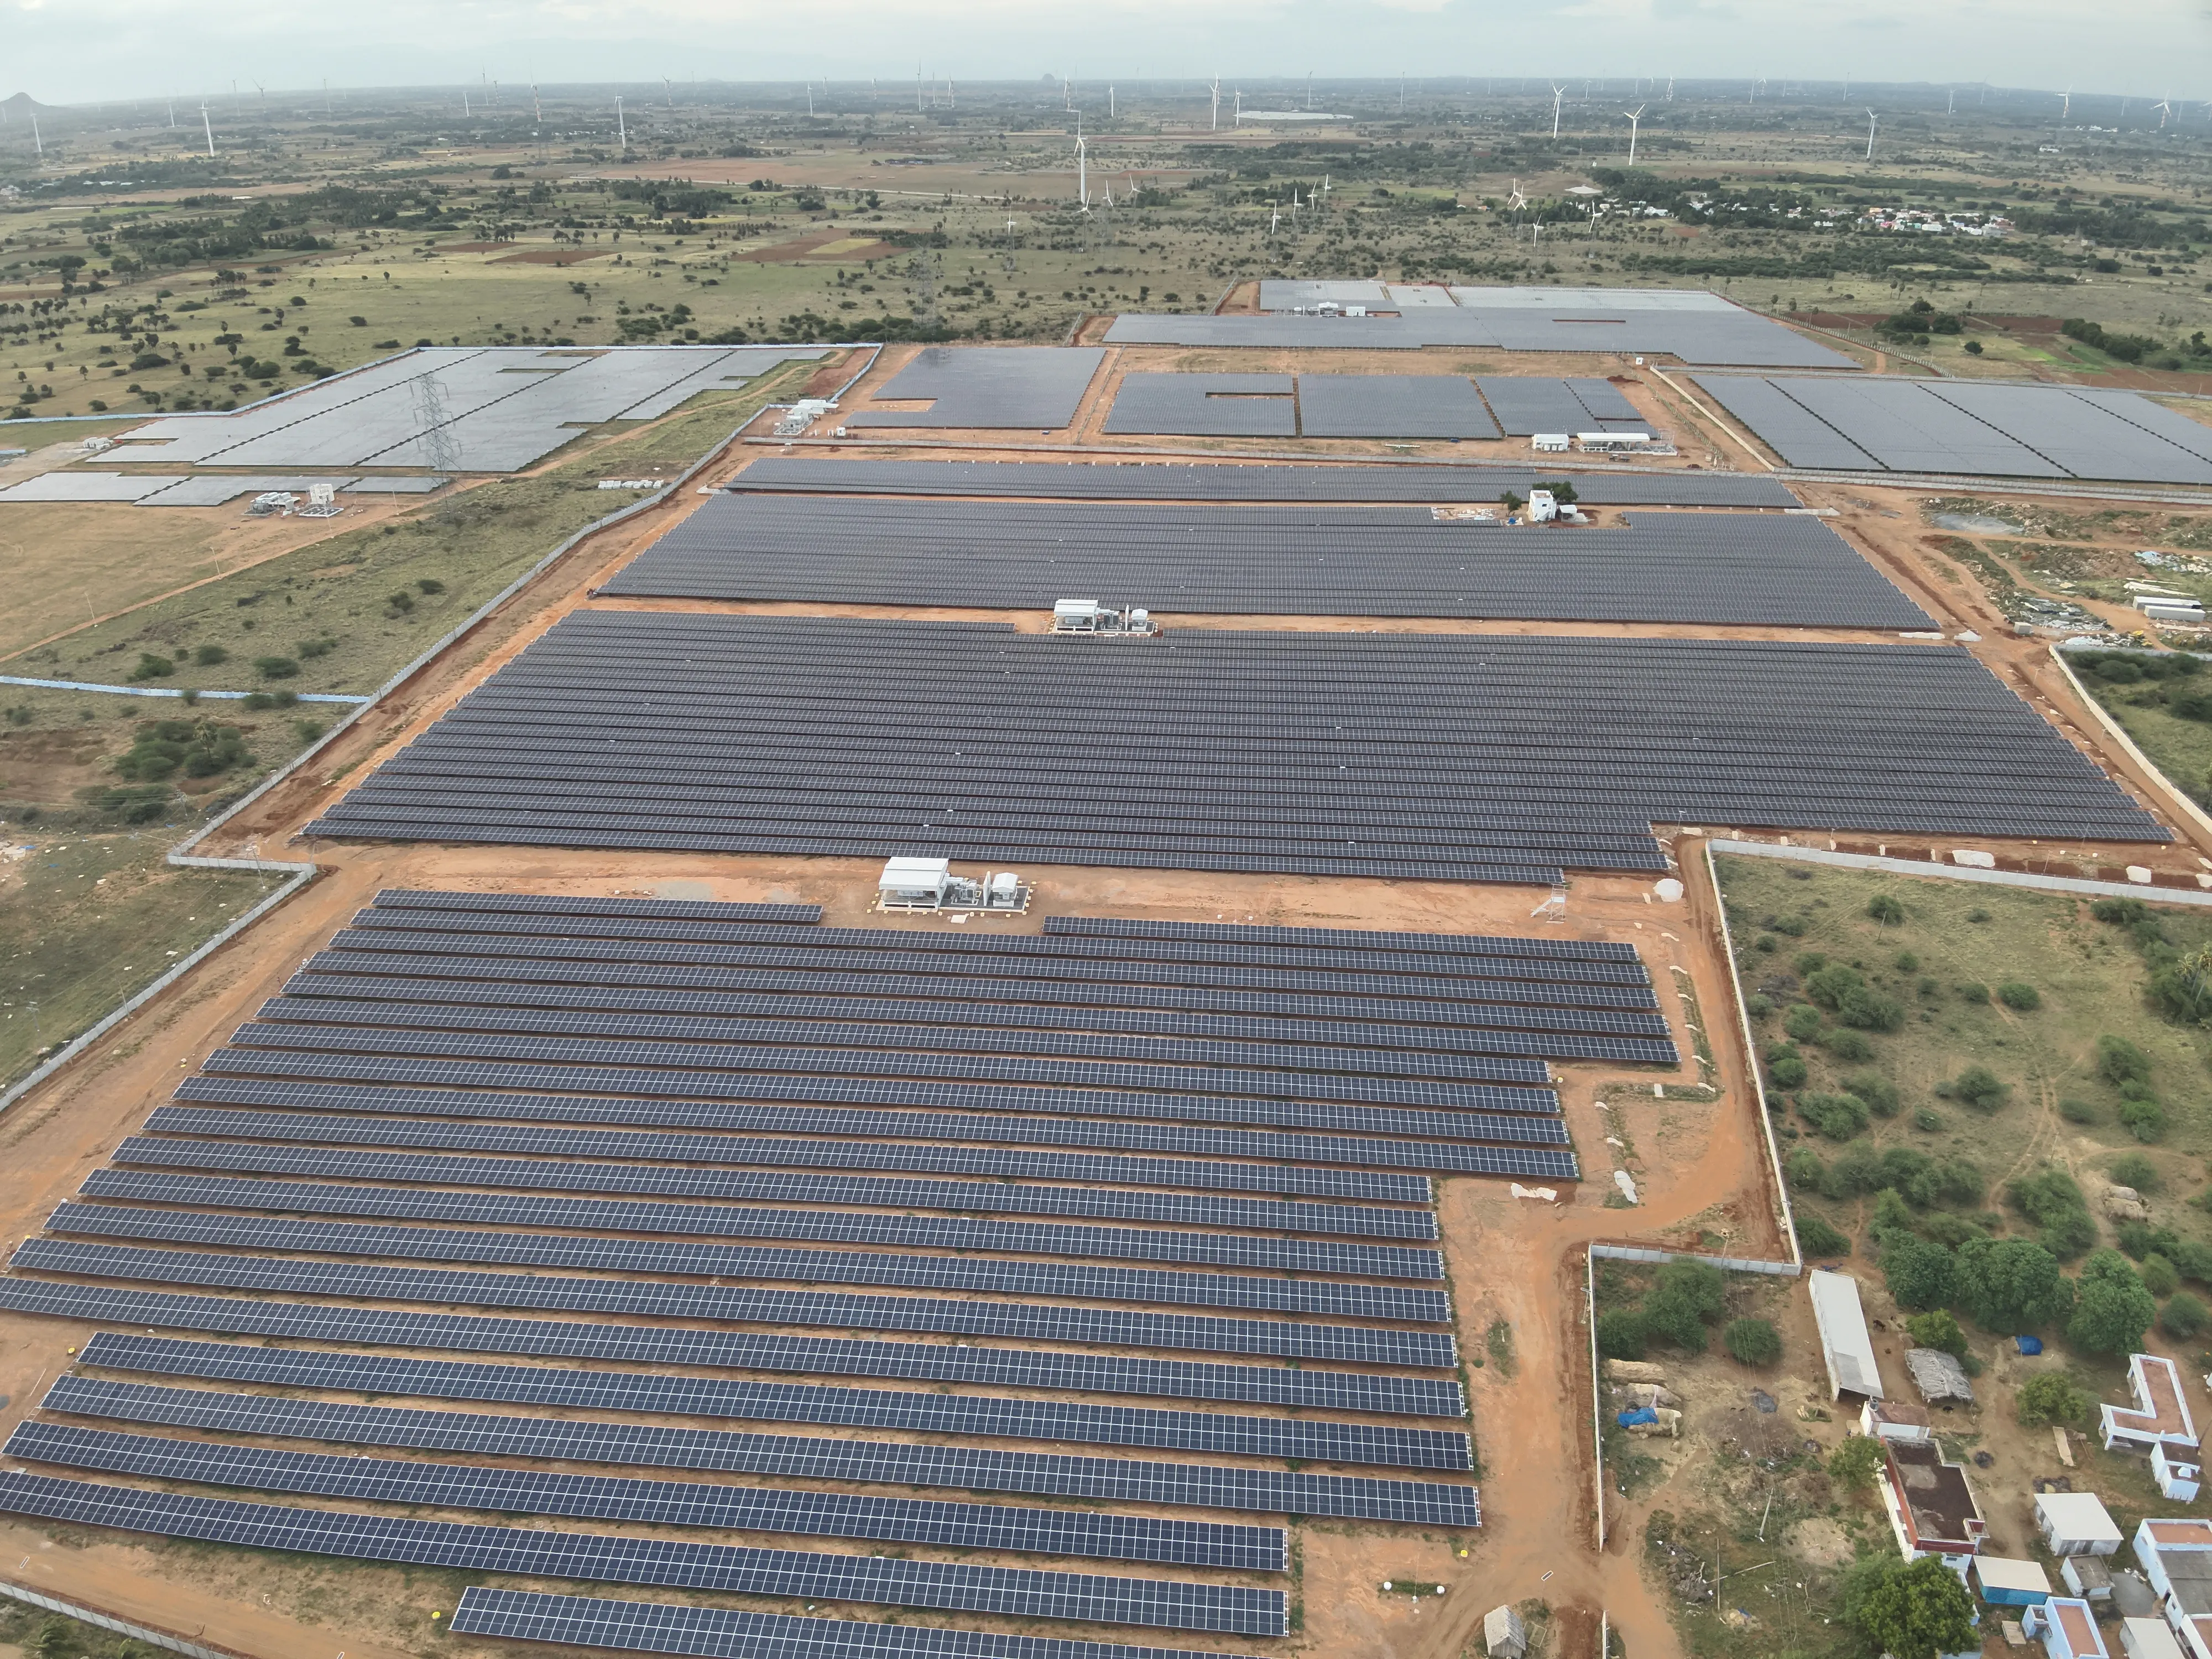
TamilNadu, India2028

810 MW Solar Plant Thermal Inspection

The challenge

The scope was a complete module-level thermal record of an 810 MW site, with every anomaly typed and counted for Sgurr Energy.

Our solution

Lesoko ran the same capture, classify and clarify workflow used on every thermal job: desktop flight planning from the array layout, an on-site toolbox talk with plant personnel, geo-tagged thermal and RGB capture, same-day cloud upload, then defect typing and criticality grading against IEC 62446-3:2017.

13,848

anomalies recorded across the plant

810 MW

plant capacity thermally inspected

5,496

sub-string short circuit records

21 days

from inspection to report submission

Impact

Sub-string short circuits (5,496) and vegetation (4,299) together account for about 71% of all records. Dust added 2,037, multiple hotspots 1,250, open circuit strings 350, hotspots 259, module hotspots 93, shadow 51 and physical damage 13.

What we noticed: a sub-string short circuit usually shows as one sub-string, about a third of a module, running warmer, which is why it is counted apart from whole-module hotspots. Vegetation and dust records point at site conditions rather than module faults, so they are counted separately from electrical faults.

Limits: the counts describe one thermal survey window, and a record is an anomaly, not a confirmed failed module. Repair status and energy recovery are not part of this report.

Explore This Service
Transmission line
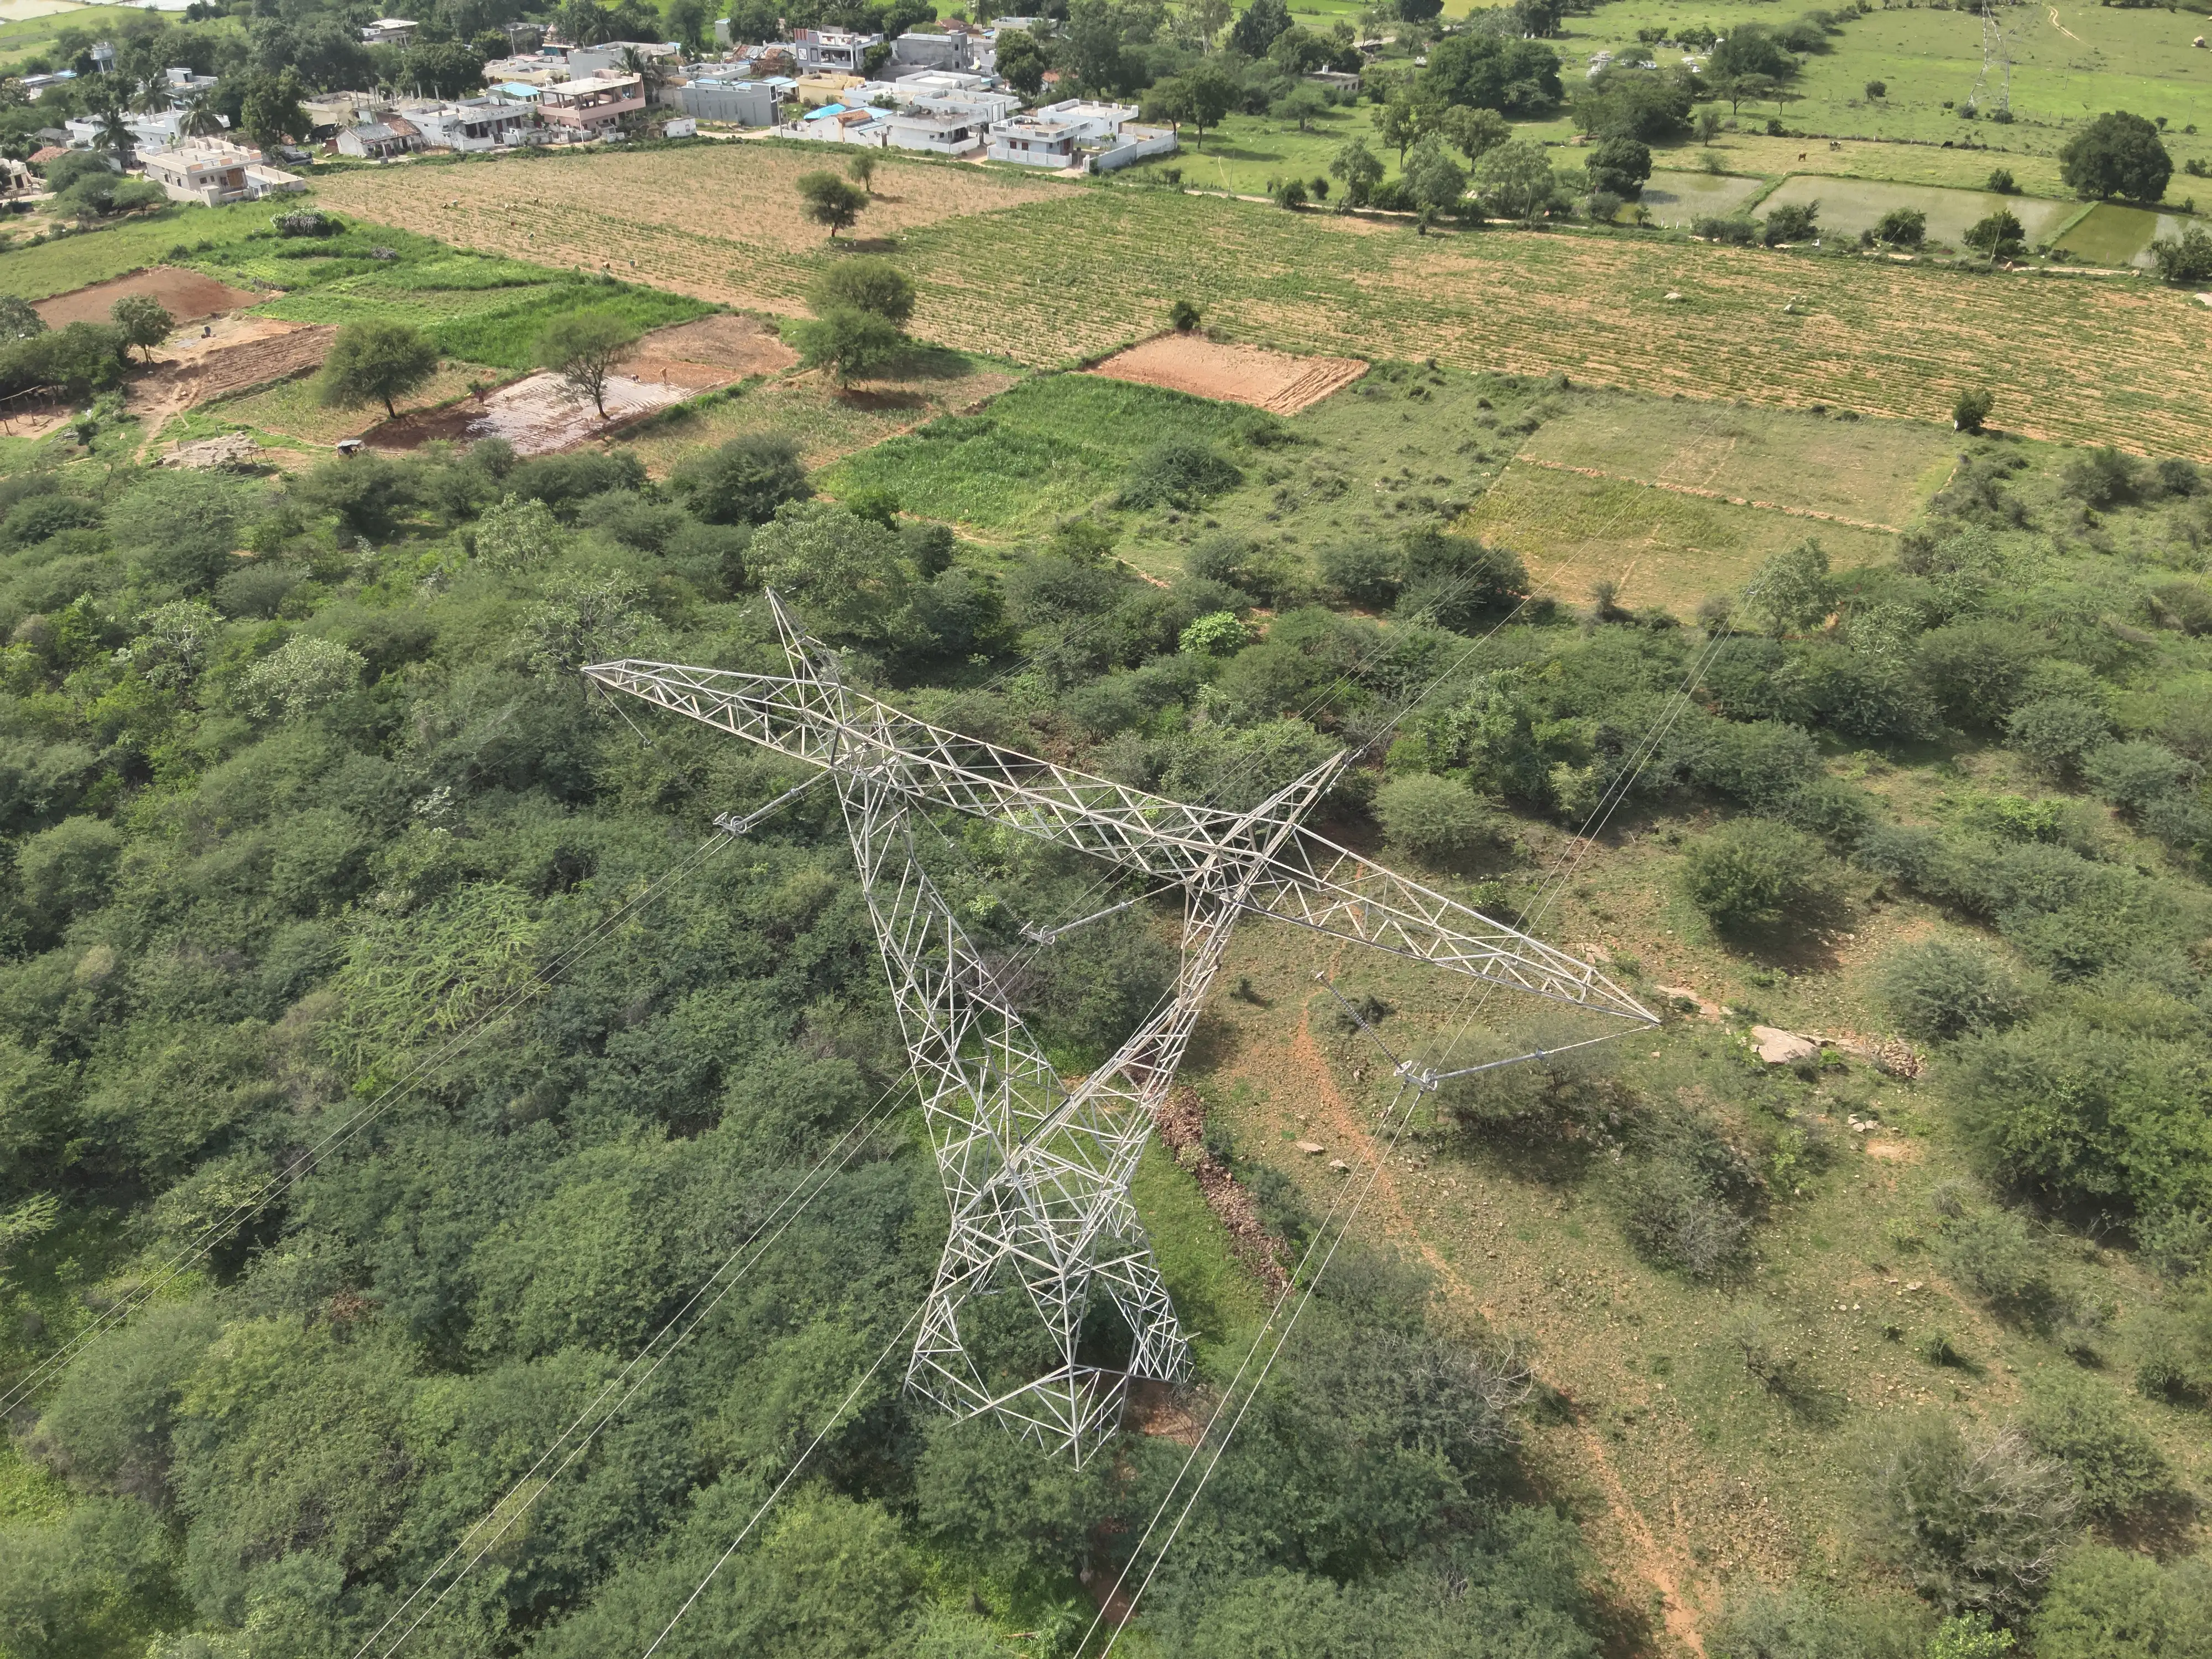
Hukkeri, Karnataka33 kV line

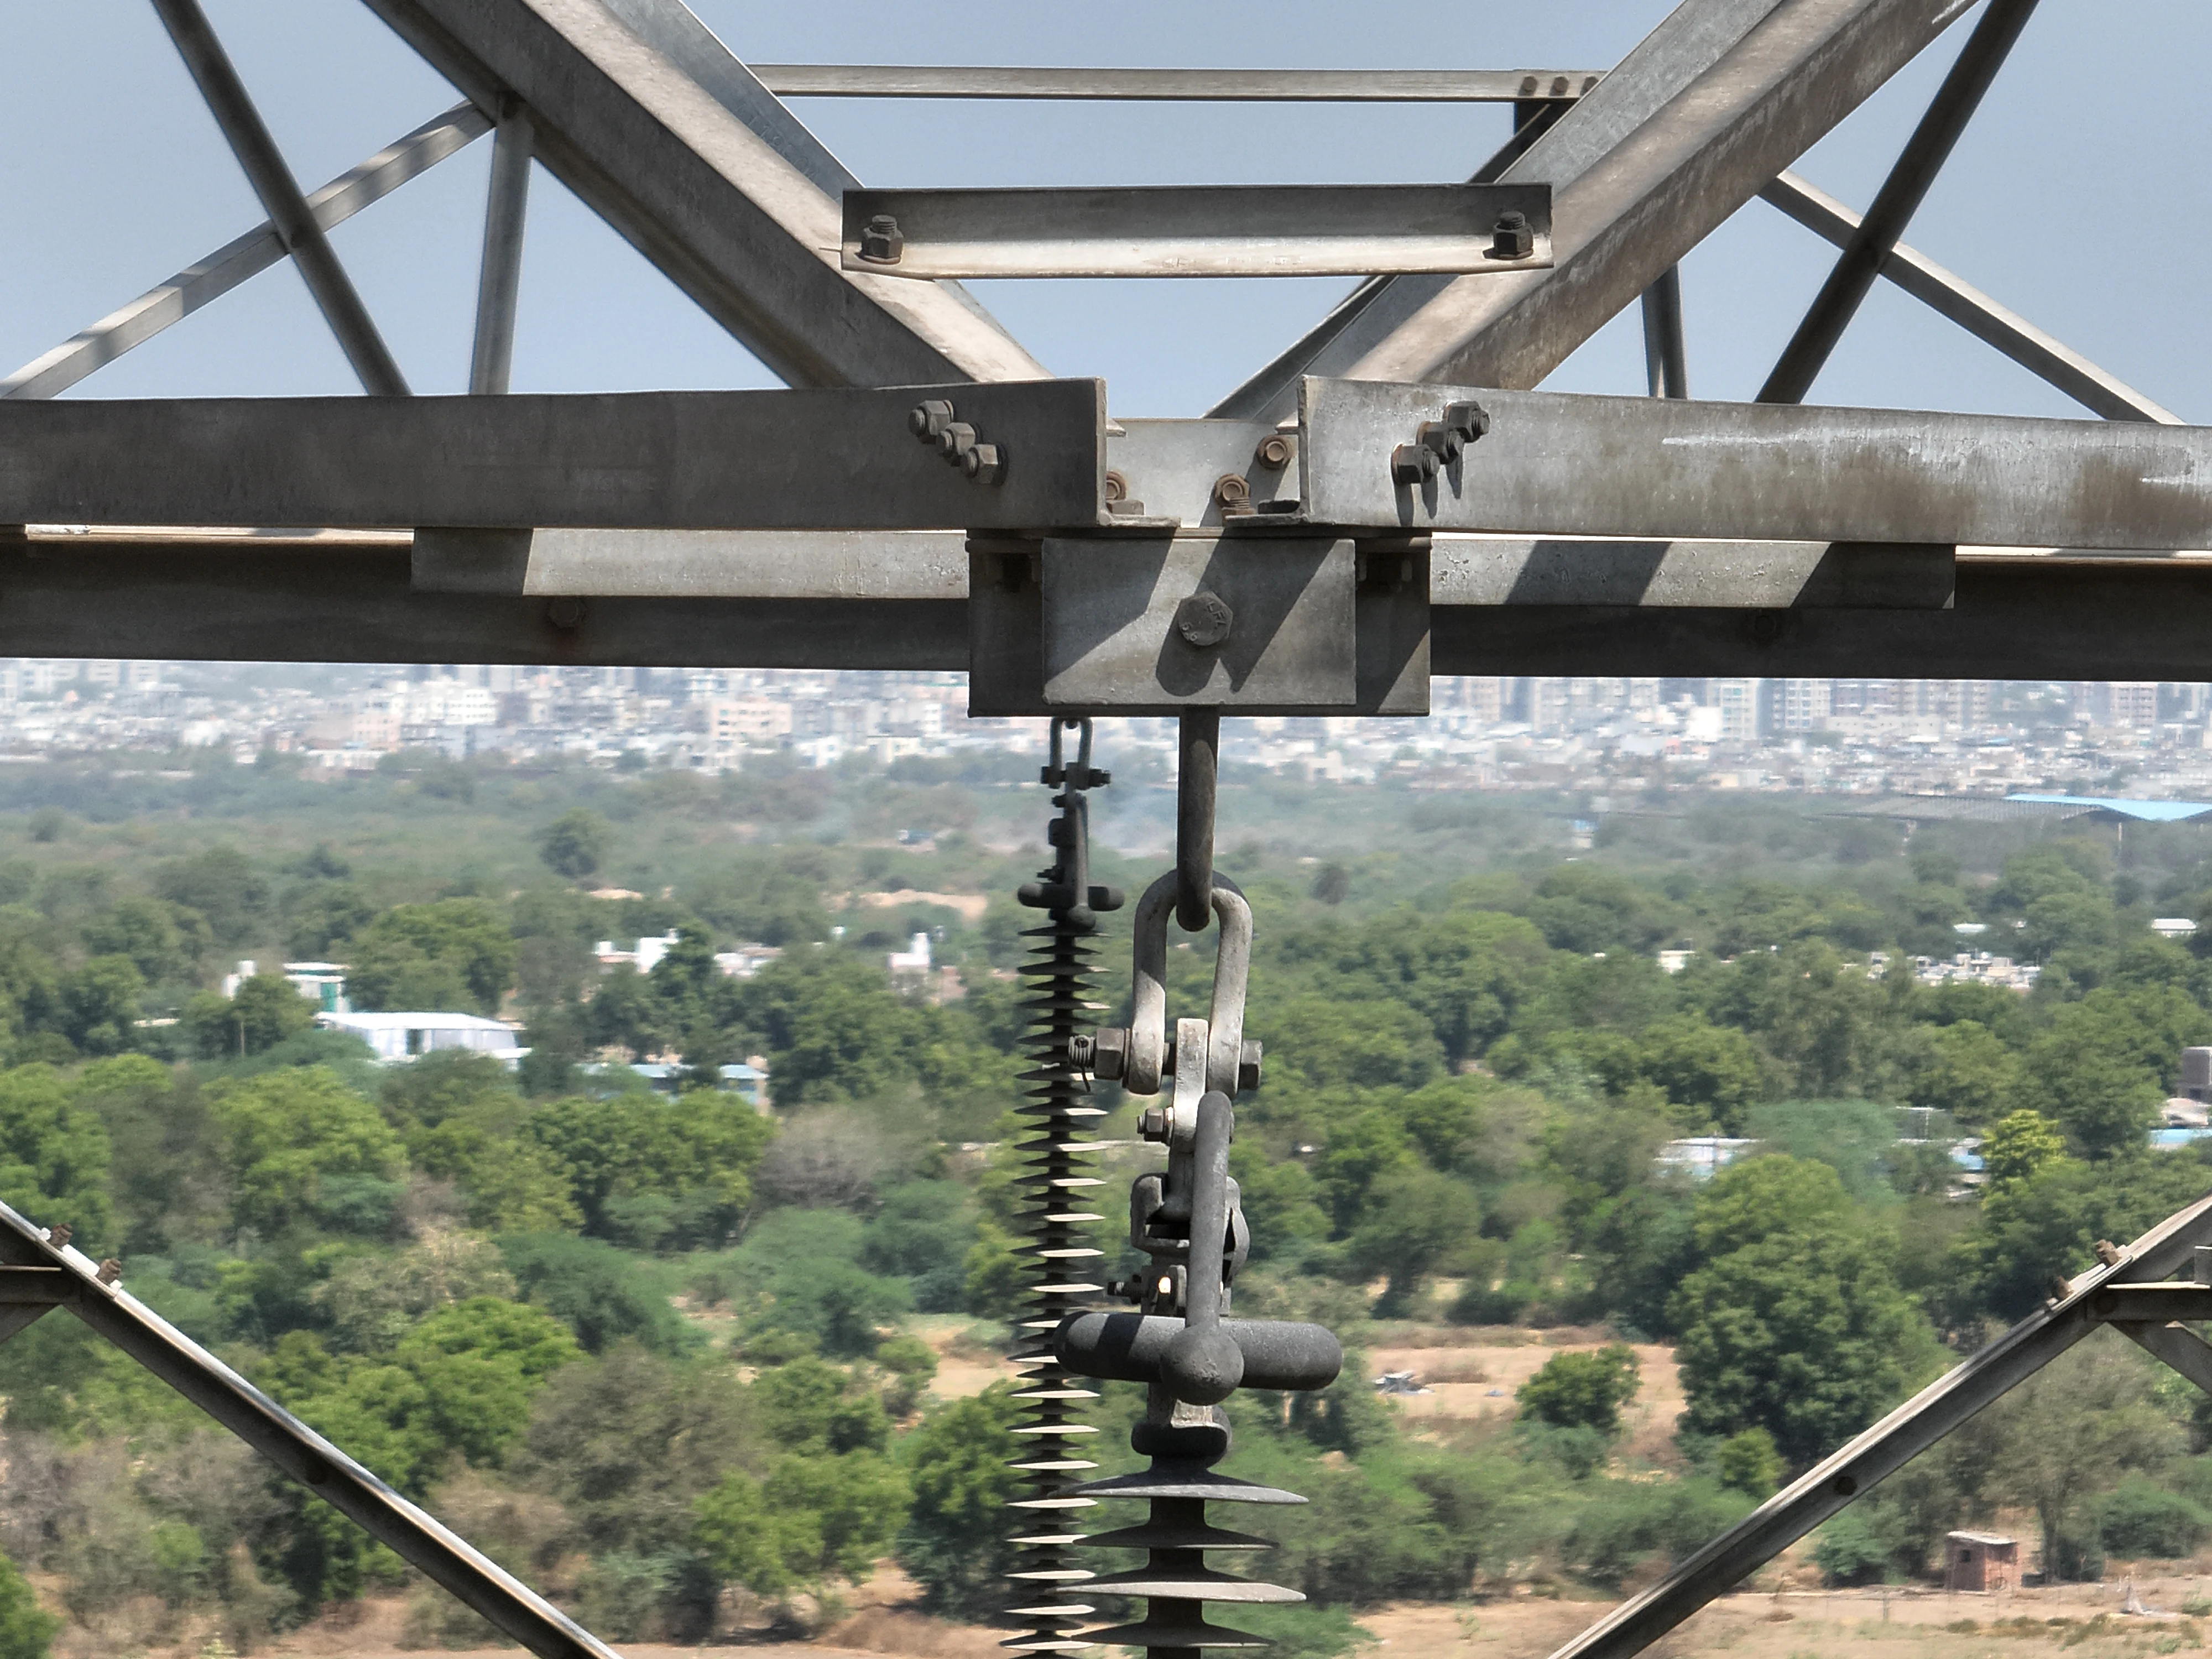
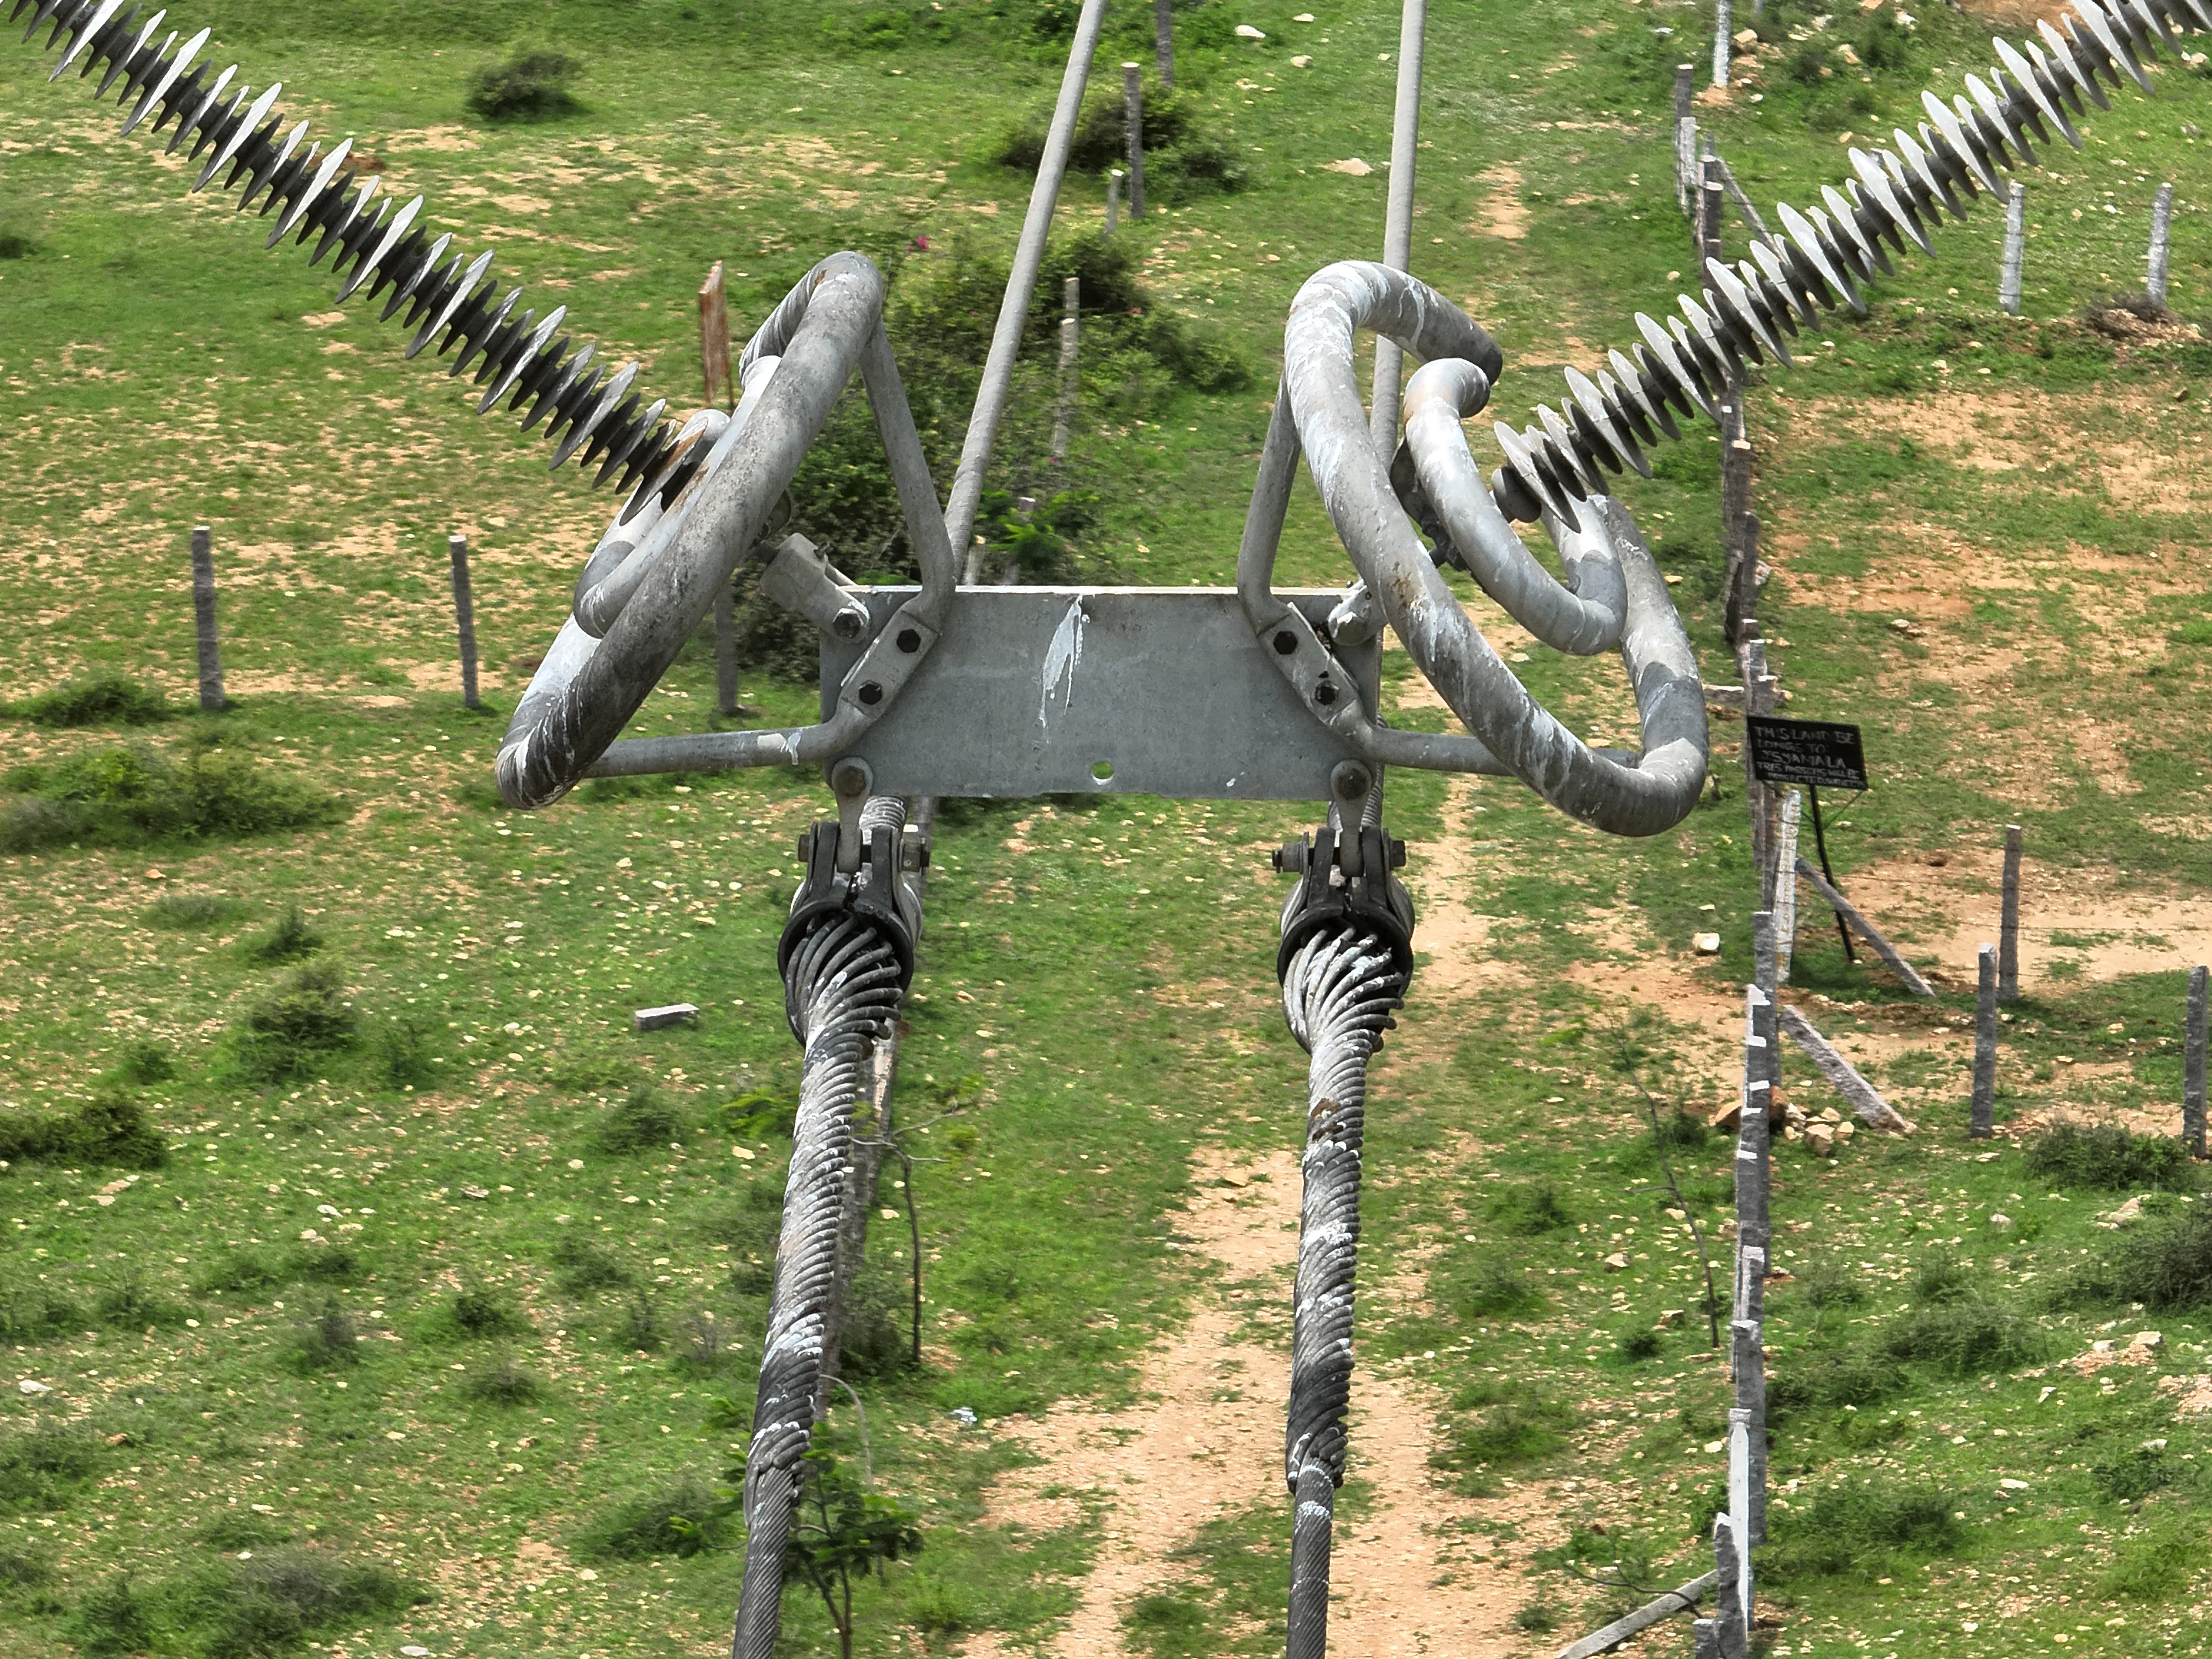
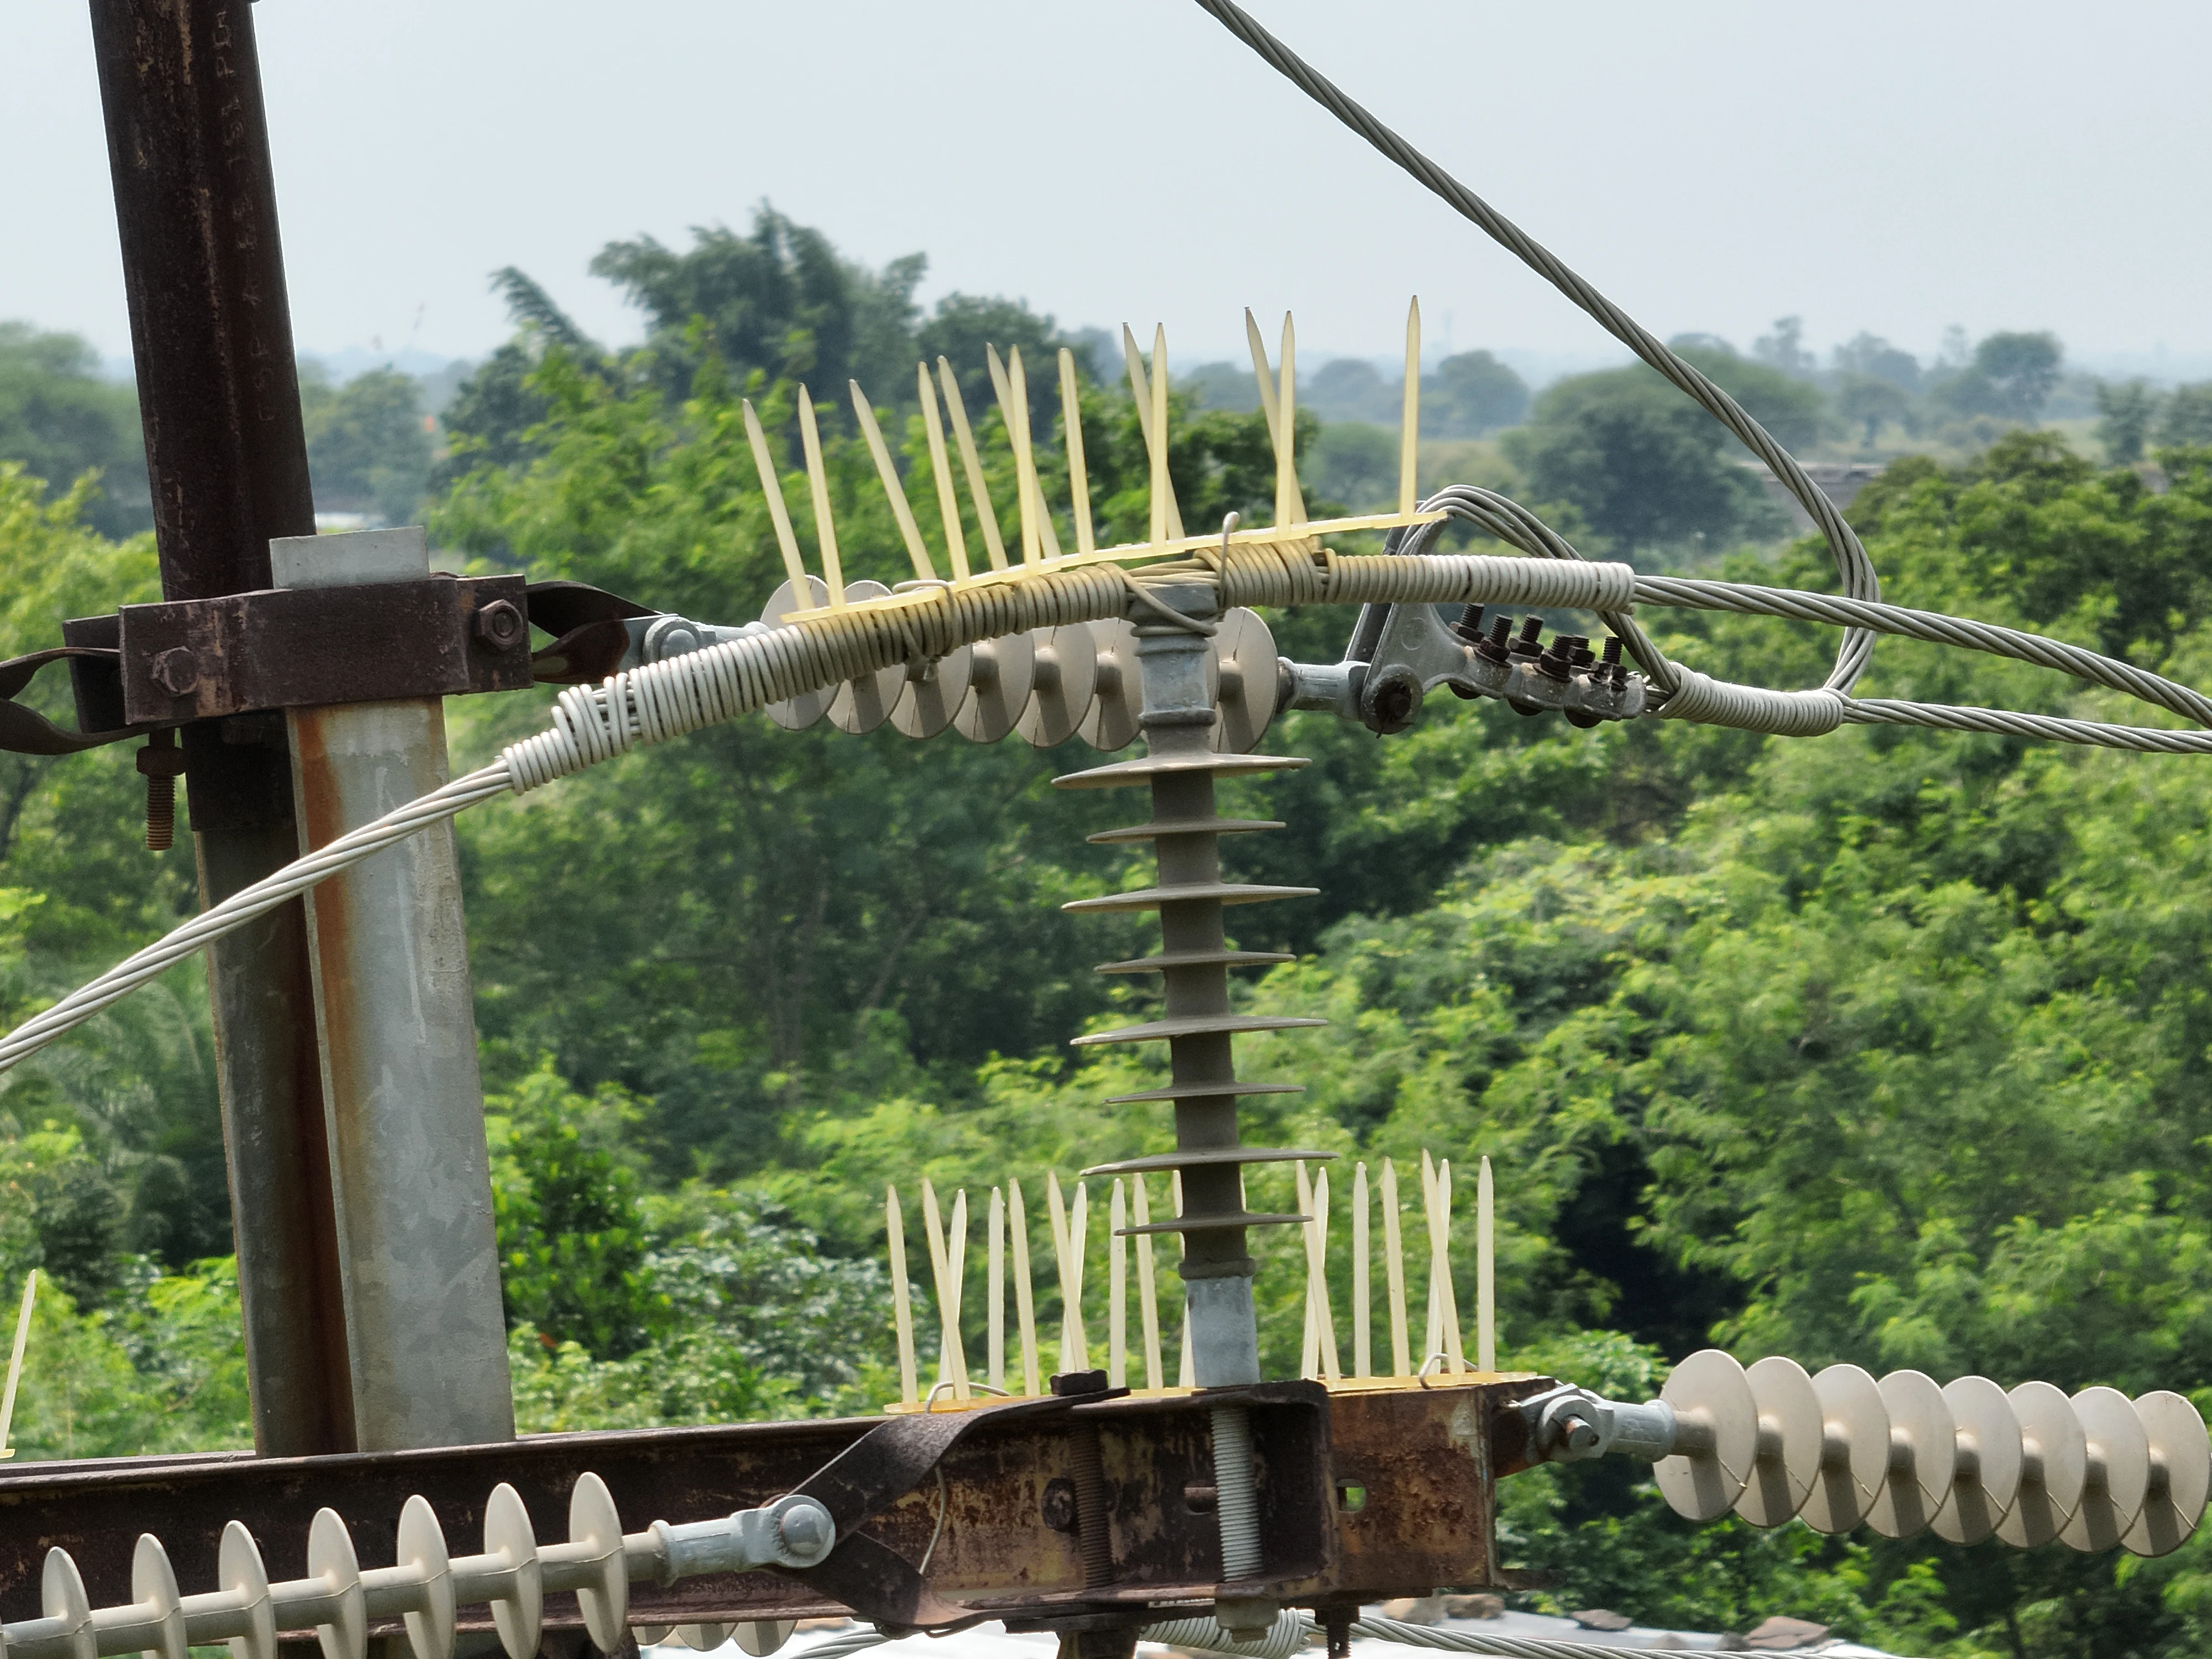
33 kV Transmission Line Tower Inspection

The challenge

The scope was a component-level condition record for a 33 kV line, with each finding tied to a tower, a sub-component and a GPS position.

Our solution

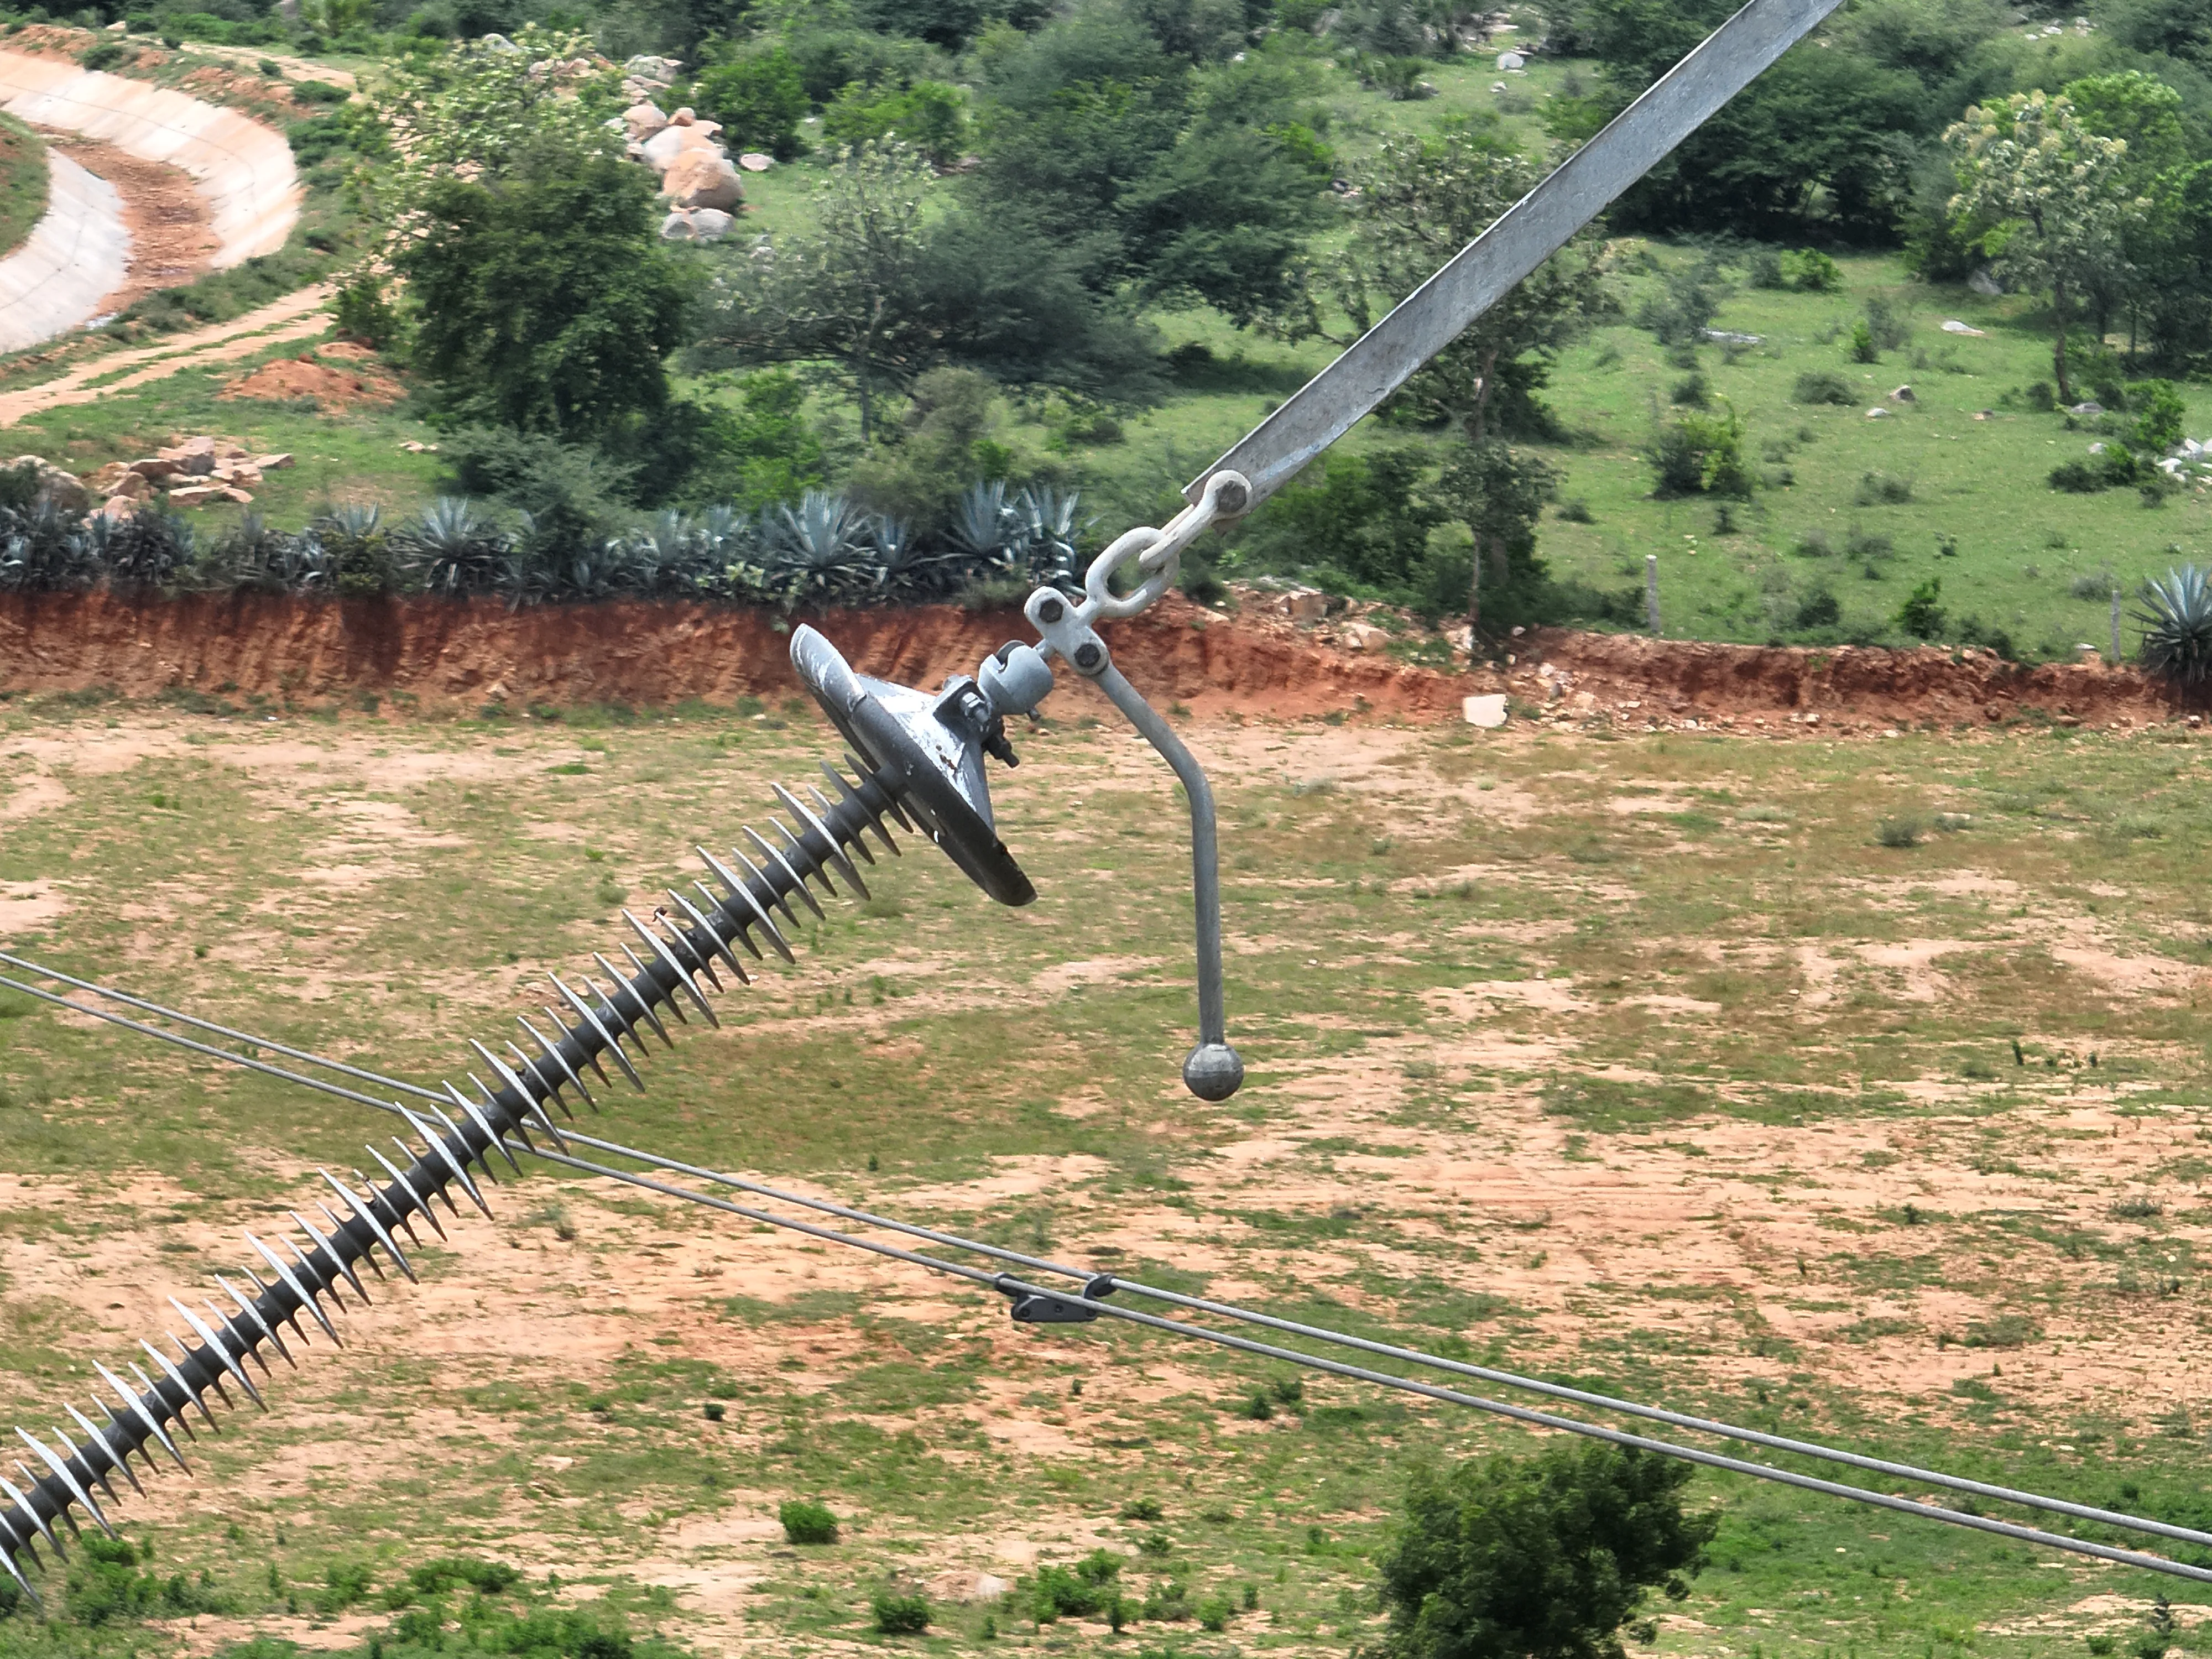
Lesoko inspected the towers by drone and logged each finding with the component and sub-component (tower body, insulator, joint, jumper, pole leg, anti-climb fence), defect type, criticality, engineer comment, coordinates, image link and thermal min, average and max readings. The result is a workbook the client can filter and track through resolution.

522

component records logged

224

towers with at least one finding

144

records rated high criticality

340

records involving corrosion

Impact

Corrosion is the main finding (340 records), followed by 144 involving hotspots and 29 vegetation. By location: tower body 151, insulators 116, anti-climb fences 109, joints 92, pole legs 27 and jumpers 27. The other 378 records are rated low criticality.

What we noticed: most findings are corrosion on structural steel and fences, while hotspots on insulators and joints carry the electrical risk, which is why the workbook separates defect type from criticality.

Limits: the 144 high-criticality records are the ones to check first. The workbook shows all records unresolved at delivery, and repair outcomes are not covered here.

Explore This Service
Land survey and mapping
Bhensola, Badnawar, Dhar, Madhya Pradesh24 Nov to 18 Dec 2025

200 MW Solar Site Topographic Survey

The challenge

A 200 MW ground-mounted solar plant on mixed terrain of flat land, dense bushes and moderate slopes needed reliable levels before layout and grading design could start, including a river corridor cutting across the site.

Our solution

A three-surveyor team set GNSS control (28 ground control points and 2 permanent benchmarks, plus pillar stations at Khedi and Nawapada villages) in WGS 84 / UTM Zone 43N. The drone was planned at 60 m (56.9 m average in processing) with 80% frontal and 70% side overlap, and the images were processed into an orthophoto, a digital terrain model, 1 m contours, 10 by 10 m spot levels and mapped site features.

25,575

images processed into the site model

1 m

contour interval from the terrain model

391 to 448 m

elevation range captured across the site

30

survey control points: 28 GCPs and 2 benchmarks

Impact

The delivered package: orthophoto, terrain model, contour drawing, RL point drawing, 10 by 10 m spot levels and a topographic feature map covering buildings, water bodies, canals, wells, roads, culverts, check dams and power lines.

The report uses the RL points for cut-and-fill assessment and grading limits, and the terrain model for drainage flow and accumulation zones.

Limits: elevations are relative to the project datum and tied to the site benchmarks; the 391 to 448 m range is the terrain model range across the surveyed boundary.

Explore This Service